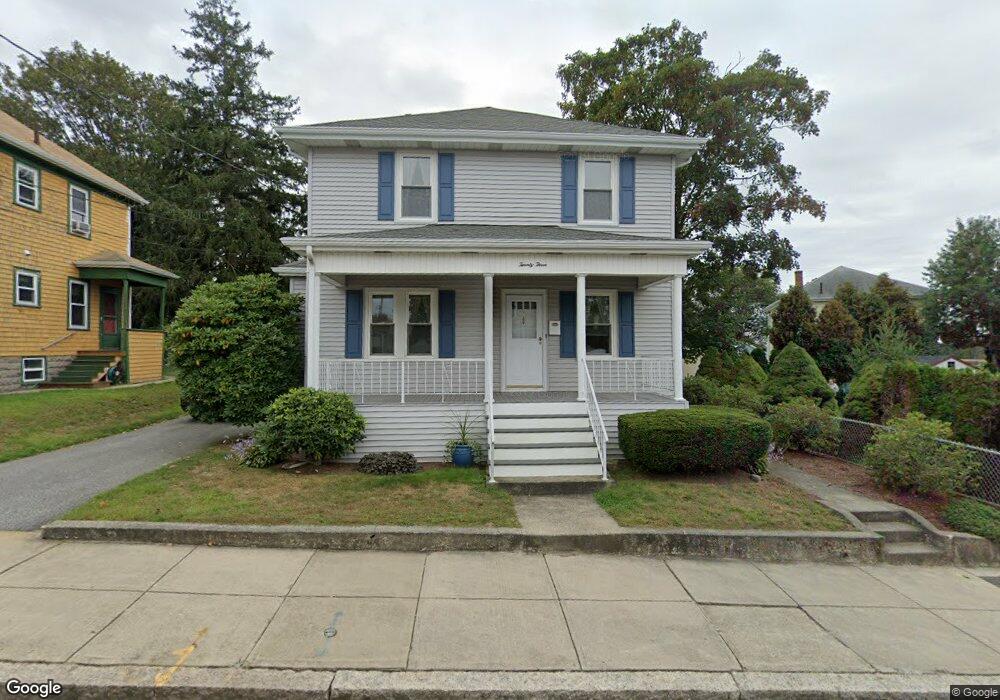
23 Bright St Fall River, MA 02721
Maplewood NeighborhoodEstimated Value: $325,000 - $408,000
4
Beds
2
Baths
1,372
Sq Ft
$265/Sq Ft
Est. Value
About This Home
This home is located at 23 Bright St, Fall River, MA 02721 and is currently estimated at $363,797, approximately $265 per square foot. 23 Bright St is a home located in Bristol County with nearby schools including Letourneau Elementary School, Matthew J. Kuss Middle School, and B M C Durfee High School.
Ownership History
Date
Name
Owned For
Owner Type
Purchase Details
Closed on
Apr 17, 2025
Sold by
Pingley Phyllis M
Bought by
Pingley Marybeth
Current Estimated Value
Purchase Details
Closed on
Jun 5, 2015
Sold by
Pingley Phyllis M
Bought by
Pingley Bradford J and Pingley Phyllis M
Purchase Details
Closed on
Apr 2, 1968
Bought by
Pingley Daniel E and Pingley Phyllis M
Create a Home Valuation Report for This Property
The Home Valuation Report is an in-depth analysis detailing your home's value as well as a comparison with similar homes in the area
Home Values in the Area
Average Home Value in this Area
Purchase History
| Date | Buyer | Sale Price | Title Company |
|---|---|---|---|
| Pingley Marybeth | -- | None Available | |
| Pingley Marybeth | -- | None Available | |
| Pingley Bradford J | -- | -- | |
| Pingley Bradford J | -- | -- | |
| Pingley Daniel E | -- | -- |
Source: Public Records
Mortgage History
| Date | Status | Borrower | Loan Amount |
|---|---|---|---|
| Previous Owner | Pingley Daniel E | $30,000 |
Source: Public Records
Tax History
| Year | Tax Paid | Tax Assessment Tax Assessment Total Assessment is a certain percentage of the fair market value that is determined by local assessors to be the total taxable value of land and additions on the property. | Land | Improvement |
|---|---|---|---|---|
| 2025 | $3,371 | $294,400 | $124,000 | $170,400 |
| 2024 | $3,171 | $276,000 | $119,300 | $156,700 |
| 2023 | $3,075 | $250,600 | $102,300 | $148,300 |
| 2022 | $2,654 | $216,200 | $93,000 | $123,200 |
| 2021 | $4,344 | $191,900 | $86,100 | $105,800 |
| 2020 | $4,309 | $181,200 | $82,400 | $98,800 |
| 2019 | $2,521 | $172,900 | $78,400 | $94,500 |
| 2018 | $2,399 | $164,100 | $77,000 | $87,100 |
| 2017 | $2,296 | $164,000 | $78,500 | $85,500 |
| 2016 | $2,209 | $162,100 | $81,800 | $80,300 |
| 2015 | $2,263 | $173,000 | $78,800 | $94,200 |
| 2014 | -- | $177,100 | $82,900 | $94,200 |
Source: Public Records
Map
Nearby Homes
Your Personal Tour Guide
Ask me questions while you tour the home.