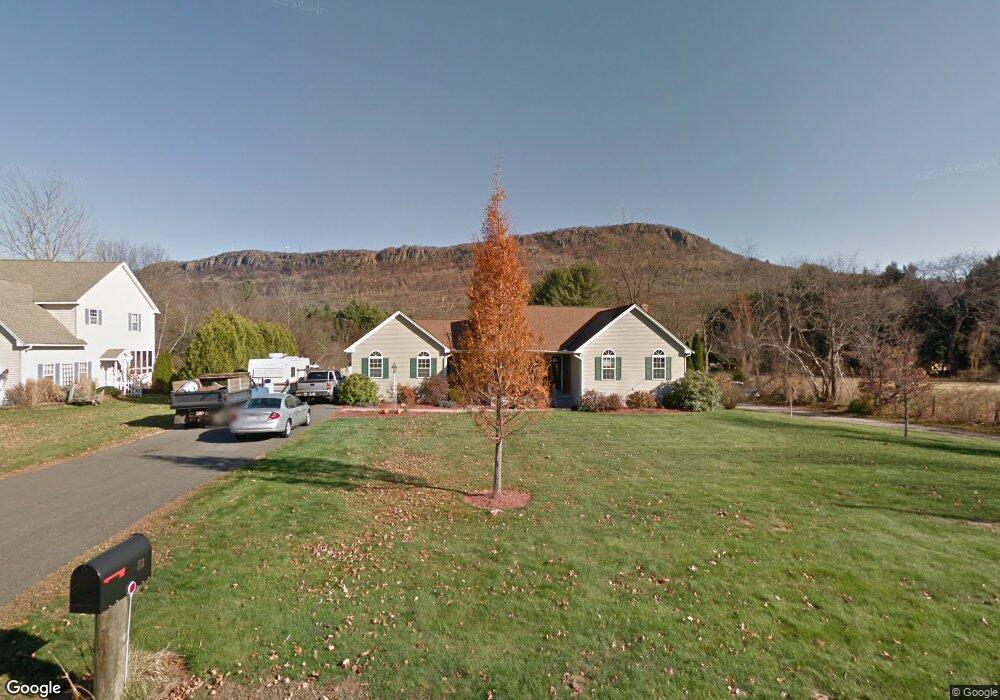
23 Brook St Easthampton, MA 01027
Estimated Value: $453,000 - $528,000
2
Beds
2
Baths
1,411
Sq Ft
$357/Sq Ft
Est. Value
About This Home
This home is located at 23 Brook St, Easthampton, MA 01027 and is currently estimated at $503,043, approximately $356 per square foot. 23 Brook St is a home located in Hampshire County with nearby schools including Easthampton High School, Tri-County Schools, and New England Adolescent Research Institute.
Ownership History
Date
Name
Owned For
Owner Type
Purchase Details
Closed on
Mar 28, 2002
Sold by
Hardy David A
Bought by
Moszynski Andrew R and Moszynski Diane M
Current Estimated Value
Home Financials for this Owner
Home Financials are based on the most recent Mortgage that was taken out on this home.
Original Mortgage
$90,000
Outstanding Balance
$37,496
Interest Rate
6.88%
Mortgage Type
Purchase Money Mortgage
Estimated Equity
$465,547
Create a Home Valuation Report for This Property
The Home Valuation Report is an in-depth analysis detailing your home's value as well as a comparison with similar homes in the area
Home Values in the Area
Average Home Value in this Area
Purchase History
| Date | Buyer | Sale Price | Title Company |
|---|---|---|---|
| Moszynski Andrew R | $207,600 | -- |
Source: Public Records
Mortgage History
| Date | Status | Borrower | Loan Amount |
|---|---|---|---|
| Open | Moszynski Andrew R | $25,000 | |
| Open | Moszynski Andrew R | $90,000 | |
| Previous Owner | Moszynski Andrew R | $164,000 | |
| Previous Owner | Moszynski Andrew R | $200,000 |
Source: Public Records
Tax History
| Year | Tax Paid | Tax Assessment Tax Assessment Total Assessment is a certain percentage of the fair market value that is determined by local assessors to be the total taxable value of land and additions on the property. | Land | Improvement |
|---|---|---|---|---|
| 2025 | $6,944 | $508,000 | $134,700 | $373,300 |
| 2024 | $7,055 | $520,300 | $130,800 | $389,500 |
| 2023 | $5,123 | $349,700 | $103,700 | $246,000 |
| 2022 | $5,781 | $349,700 | $103,700 | $246,000 |
| 2021 | $6,655 | $379,400 | $103,700 | $275,700 |
| 2020 | $6,211 | $349,700 | $103,700 | $246,000 |
| 2019 | $5,014 | $324,300 | $103,700 | $220,600 |
| 2018 | $4,797 | $299,800 | $97,600 | $202,200 |
| 2017 | $4,686 | $289,100 | $93,800 | $195,300 |
| 2016 | $4,671 | $299,600 | $93,800 | $205,800 |
| 2015 | $4,539 | $299,600 | $93,800 | $205,800 |
Source: Public Records
Map
Nearby Homes
Your Personal Tour Guide
Ask me questions while you tour the home.