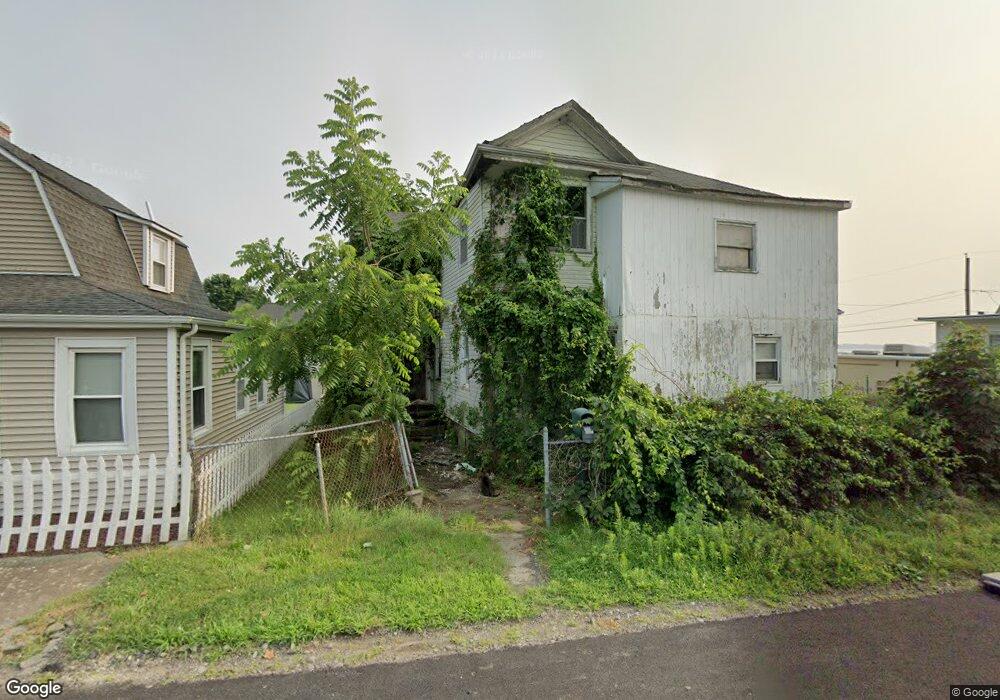
23 Bryan St Fall River, MA 02724
Sandy Beach NeighborhoodEstimated Value: $291,000 - $535,000
4
Beds
2
Baths
1,646
Sq Ft
$236/Sq Ft
Est. Value
About This Home
This home is located at 23 Bryan St, Fall River, MA 02724 and is currently estimated at $388,370, approximately $235 per square foot. 23 Bryan St is a home located in Bristol County with nearby schools including Henry Lord Community School, B M C Durfee High School, and Argosy Collegiate Charter School.
Ownership History
Date
Name
Owned For
Owner Type
Purchase Details
Closed on
Dec 20, 2024
Sold by
Gabbour Anna H Est and Marsden
Bought by
Azylor Build & Design Llc
Current Estimated Value
Home Financials for this Owner
Home Financials are based on the most recent Mortgage that was taken out on this home.
Original Mortgage
$320,000
Outstanding Balance
$317,483
Interest Rate
6.79%
Mortgage Type
Purchase Money Mortgage
Estimated Equity
$70,887
Purchase Details
Closed on
Sep 28, 1979
Bought by
Gabbour Anna H
Create a Home Valuation Report for This Property
The Home Valuation Report is an in-depth analysis detailing your home's value as well as a comparison with similar homes in the area
Home Values in the Area
Average Home Value in this Area
Purchase History
| Date | Buyer | Sale Price | Title Company |
|---|---|---|---|
| Azylor Build & Design Llc | $211,000 | None Available | |
| Azylor Build & Design Llc | $211,000 | None Available | |
| Gabbour Anna H | -- | -- |
Source: Public Records
Mortgage History
| Date | Status | Borrower | Loan Amount |
|---|---|---|---|
| Open | Azylor Build & Design Llc | $320,000 | |
| Closed | Azylor Build & Design Llc | $320,000 |
Source: Public Records
Tax History
| Year | Tax Paid | Tax Assessment Tax Assessment Total Assessment is a certain percentage of the fair market value that is determined by local assessors to be the total taxable value of land and additions on the property. | Land | Improvement |
|---|---|---|---|---|
| 2025 | $2,682 | $234,200 | $131,200 | $103,000 |
| 2024 | $2,538 | $220,900 | $128,600 | $92,300 |
| 2023 | $2,377 | $193,700 | $115,900 | $77,800 |
| 2022 | $2,170 | $178,000 | $109,300 | $68,700 |
| 2021 | $3,462 | $156,900 | $104,400 | $52,500 |
| 2020 | $3,354 | $142,000 | $99,700 | $42,300 |
| 2019 | $1,519 | $143,500 | $104,200 | $39,300 |
| 2018 | $3,200 | $144,000 | $104,900 | $39,100 |
| 2017 | $1,987 | $141,900 | $104,900 | $37,000 |
| 2016 | $1,967 | $144,300 | $108,200 | $36,100 |
| 2015 | $2,306 | $176,300 | $108,200 | $68,100 |
| 2014 | $2,292 | $182,200 | $108,200 | $74,000 |
Source: Public Records
Map
Nearby Homes
- 24 Valley St
- 391 Clarkson St
- 579 Summit St Unit 3
- 579 Summit St Unit 2
- 616 Woodman St
- 126 Wheeler St
- 30 Broad St
- 42 Main Rd
- 2229 S Main St
- 245 Dwelly St
- 25 Mathew Rd
- 609 King Philip St
- 29 Robert St
- 15 Higgins St
- 57 Larouche St
- 1852 S Main St
- 1846 S Main St
- 12 Horizon Dr
- 347 Main Rd Unit 103
- 359 Main Rd
Your Personal Tour Guide
Ask me questions while you tour the home.