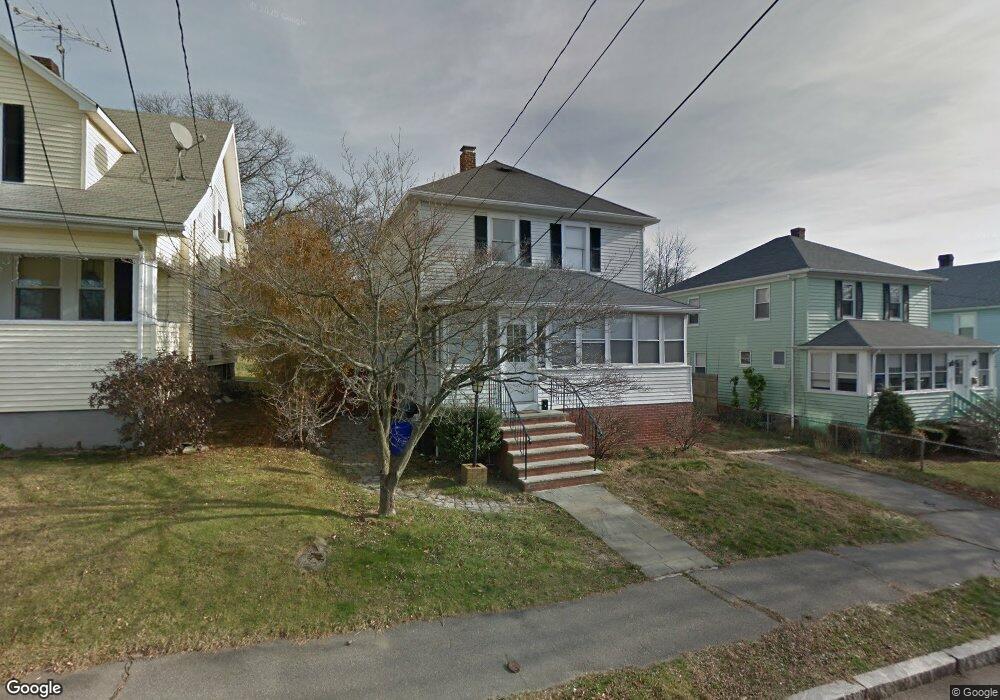
23 Burns Ave Quincy, MA 02169
Quincy Point NeighborhoodEstimated Value: $537,000 - $674,000
3
Beds
1
Bath
1,296
Sq Ft
$471/Sq Ft
Est. Value
About This Home
This home is located at 23 Burns Ave, Quincy, MA 02169 and is currently estimated at $609,835, approximately $470 per square foot. 23 Burns Ave is a home located in Norfolk County with nearby schools including Point Webster Middle School, Clifford H. Marshall Elementary School, and Quincy High School.
Ownership History
Date
Name
Owned For
Owner Type
Purchase Details
Closed on
Sep 9, 2022
Sold by
Polley Shawn D
Bought by
Mu Dakai and Gong Yi
Current Estimated Value
Home Financials for this Owner
Home Financials are based on the most recent Mortgage that was taken out on this home.
Original Mortgage
$348,750
Outstanding Balance
$332,392
Interest Rate
5.3%
Mortgage Type
Purchase Money Mortgage
Estimated Equity
$277,443
Create a Home Valuation Report for This Property
The Home Valuation Report is an in-depth analysis detailing your home's value as well as a comparison with similar homes in the area
Home Values in the Area
Average Home Value in this Area
Purchase History
| Date | Buyer | Sale Price | Title Company |
|---|---|---|---|
| Mu Dakai | $465,000 | None Available |
Source: Public Records
Mortgage History
| Date | Status | Borrower | Loan Amount |
|---|---|---|---|
| Open | Mu Dakai | $348,750 |
Source: Public Records
Tax History Compared to Growth
Tax History
| Year | Tax Paid | Tax Assessment Tax Assessment Total Assessment is a certain percentage of the fair market value that is determined by local assessors to be the total taxable value of land and additions on the property. | Land | Improvement |
|---|---|---|---|---|
| 2025 | $6,634 | $575,400 | $311,500 | $263,900 |
| 2024 | $6,258 | $555,300 | $296,800 | $258,500 |
| 2023 | $5,683 | $510,600 | $270,100 | $240,500 |
| 2022 | $5,586 | $466,300 | $245,900 | $220,400 |
| 2021 | $5,561 | $458,100 | $245,900 | $212,200 |
| 2020 | $5,267 | $423,700 | $232,100 | $191,600 |
| 2019 | $4,994 | $397,900 | $215,100 | $182,800 |
| 2018 | $4,805 | $360,200 | $195,900 | $164,300 |
| 2017 | $4,753 | $335,400 | $186,700 | $148,700 |
| 2016 | $4,444 | $309,500 | $170,000 | $139,500 |
| 2015 | $4,208 | $288,200 | $160,500 | $127,700 |
| 2014 | $4,139 | $278,500 | $160,500 | $118,000 |
Source: Public Records
Map
Nearby Homes
- 200 Falls Blvd Unit B305
- 200 Falls Blvd Unit C308
- 19 Keyes St
- 25 5th Ave
- 51 Sumner St
- 32 Sumner St
- 16 Dartmouth St Unit 16
- 934 Southern Artery Unit 109
- 15 Bower Rd Unit B5
- 15 Bower Rd Unit A2
- 15 Bower Rd Unit B2
- 41 Broadway
- 25 W Howard St Unit D2
- 161 Sumner St Unit 2
- 161 Sumner St Unit 4
- 16 Perley Place
- 26 Lawrence St
- 313 Washington St
- 166 Phipps St
- 585 Washington St Unit model-1