23 Carriage Ln Walpole, MA 02081
Walpole AreaEstimated Value: $1,043,548 - $1,374,000
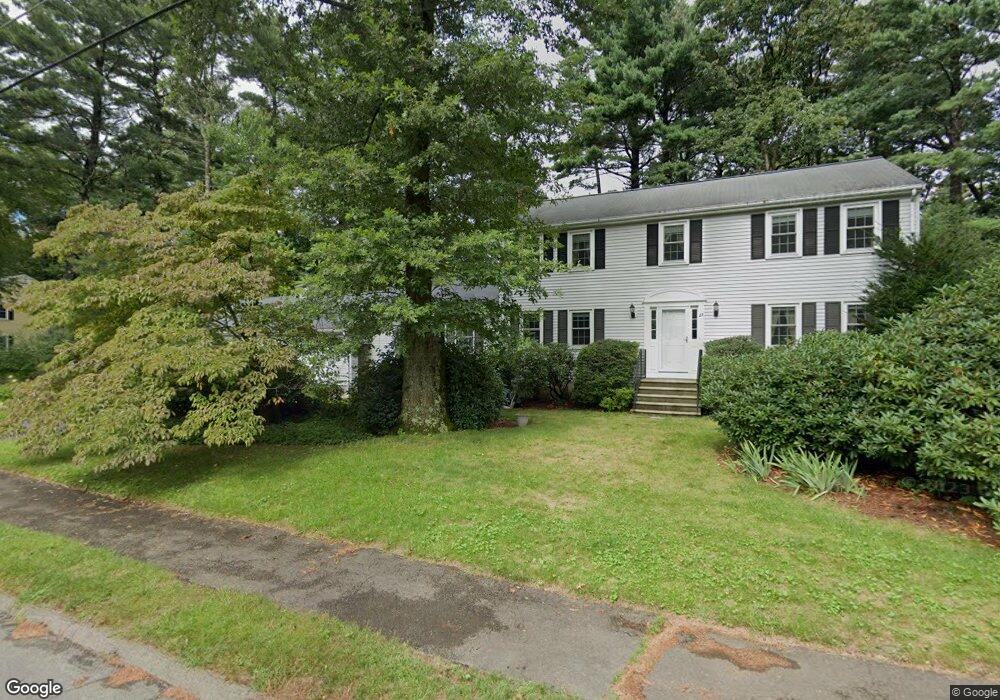
About This Home
This home is located at 23 Carriage Ln, Walpole, MA 02081 and is currently estimated at $1,198,887, approximately $451 per square foot. 23 Carriage Ln is a home located in Norfolk County with nearby schools including Old Post Road School, Walpole Middle School, and Walpole High School.
Ownership History
We collect this data history from publicly available records. To have your information removed, we recommend requesting removal directly through your county’s website.
Purchase Details
Home Values in the Area
Average Home Value in this Area
Purchase History
We collect this data history from publicly available records. To have your information removed, we recommend requesting removal directly through your county’s website.
| Date | Buyer | Sale Price | Title Company |
|---|---|---|---|
| $272,000 | -- |
Mortgage History
We collect this data history from publicly available records. To have your information removed, we recommend requesting removal directly through your county’s website.
| Date | Status | Borrower | Loan Amount |
|---|---|---|---|
| Open | $130,000 | ||
| Closed | $150,000 |
Tax History
We collect this data history from publicly available records. To have your information removed, we recommend requesting removal directly through your county’s website.
| Year | Tax Paid | Tax Assessment Tax Assessment Total Assessment is a certain percentage of the fair market value that is determined by local assessors to be the total taxable value of land and additions on the property. | Land | Improvement |
|---|---|---|---|---|
| 2025 | $11,389 | $887,700 | $354,200 | $533,500 |
| 2024 | $11,007 | $832,600 | $340,600 | $492,000 |
| 2023 | $10,449 | $752,300 | $296,200 | $456,100 |
| 2022 | $9,791 | $677,100 | $274,300 | $402,800 |
| 2021 | $9,624 | $648,500 | $258,700 | $389,800 |
| 2020 | $9,201 | $613,800 | $244,100 | $369,700 |
| 2019 | $8,885 | $588,400 | $234,700 | $353,700 |
| 2018 | $8,776 | $574,700 | $226,600 | $348,100 |
| 2017 | $8,536 | $556,800 | $217,900 | $338,900 |
| 2016 | $8,286 | $532,500 | $209,500 | $323,000 |
| 2015 | $7,976 | $508,000 | $199,700 | $308,300 |
| 2014 | $7,666 | $486,400 | $199,700 | $286,700 |
Map
- 142 Baker St
- 40 Neal St
- 745 Washington St
- 8 Rainbow Pond Dr Unit 5
- 24 Pontiac Rd
- 635 Old Post Rd Unit 2-303
- 19 Rainbow Pond Dr Unit B2
- 261 Stone St
- 8 Bristol Ln
- 21 Grover St
- 560 Common St
- 510 Common St
- 8 Lewis Park Dr S
- 532 Washington St
- 19 Old Diamond St Unit 19
- 278 Common St
- 201 Stone St
- 24 Cinnamon Cir
- 32 Pall Mall
- 335 Moosehill Rd
Ask me questions while you tour the home.