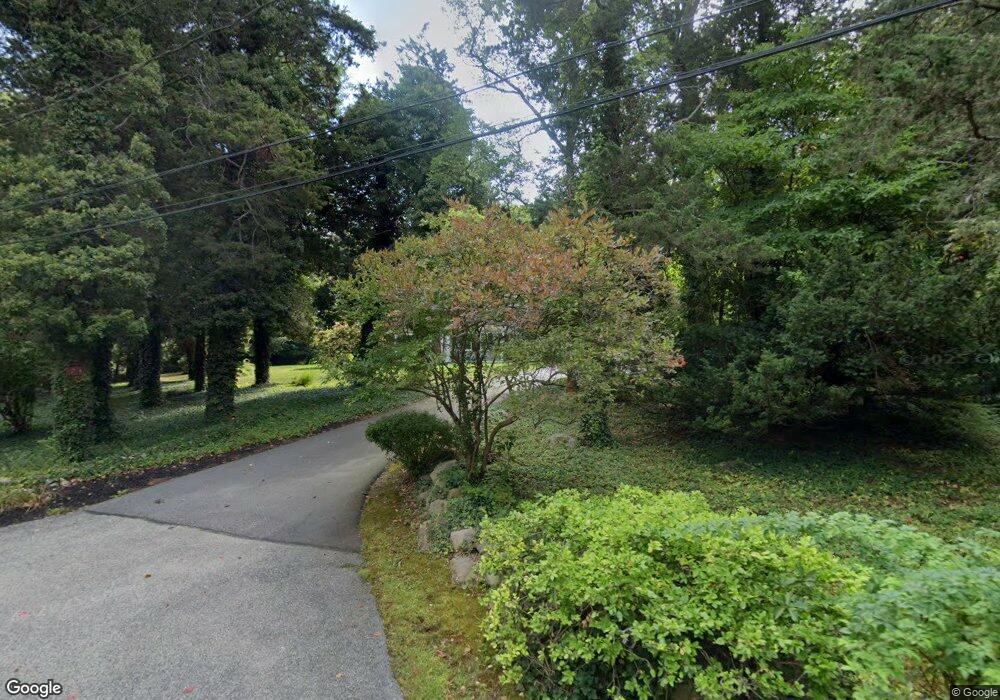
23 Cedar Ln Cohasset, MA 02025
Estimated Value: $1,135,000 - $1,346,000
3
Beds
2
Baths
2,177
Sq Ft
$562/Sq Ft
Est. Value
About This Home
This home is located at 23 Cedar Ln, Cohasset, MA 02025 and is currently estimated at $1,222,726, approximately $561 per square foot. 23 Cedar Ln is a home located in Norfolk County with nearby schools including Joseph Osgood School, Deer Hill School, and Cohasset Middle School.
Ownership History
Date
Name
Owned For
Owner Type
Purchase Details
Closed on
Jul 23, 2009
Sold by
Stansell Robert A and Stansell Moira A
Bought by
Stansell Robert A and Stansell Moira A
Current Estimated Value
Create a Home Valuation Report for This Property
The Home Valuation Report is an in-depth analysis detailing your home's value as well as a comparison with similar homes in the area
Home Values in the Area
Average Home Value in this Area
Purchase History
| Date | Buyer | Sale Price | Title Company |
|---|---|---|---|
| Stansell Robert A | -- | -- |
Source: Public Records
Tax History
| Year | Tax Paid | Tax Assessment Tax Assessment Total Assessment is a certain percentage of the fair market value that is determined by local assessors to be the total taxable value of land and additions on the property. | Land | Improvement |
|---|---|---|---|---|
| 2025 | $11,233 | $970,000 | $722,300 | $247,700 |
| 2024 | $10,341 | $849,700 | $602,000 | $247,700 |
| 2023 | $8,054 | $682,500 | $434,800 | $247,700 |
| 2022 | $8,349 | $664,700 | $434,800 | $229,900 |
| 2021 | $8,360 | $641,100 | $434,800 | $206,300 |
| 2020 | $8,315 | $641,100 | $434,800 | $206,300 |
| 2019 | $8,270 | $641,100 | $434,800 | $206,300 |
| 2018 | $8,200 | $641,100 | $434,800 | $206,300 |
| 2017 | $7,909 | $605,600 | $434,800 | $170,800 |
| 2016 | $7,800 | $605,600 | $434,800 | $170,800 |
| 2015 | $7,379 | $580,600 | $409,800 | $170,800 |
| 2014 | $7,281 | $580,600 | $409,800 | $170,800 |
Source: Public Records
Map
Nearby Homes
- 96 Black Horse Ln
- 68 Black Horse Ln
- 70 Black Horse Ln
- 98 Black Horse Ln
- 171 S Main St
- 40 Pond St
- 66 Summer St
- 124 Elm St Unit 308
- 817 Country Way
- 71 Ledgewood Dr
- 128 Elm St Unit 211
- 45 Hemlock Way
- 46 Pond St
- 104 Howard Gleason Rd
- 26 Mordecai Lincoln Rd
- 100 Howard Gleason Rd
- 47 Highland Ave
- 28 Bayberry Ln
- 7 3 Ring Rd
- 135 Beach St
Your Personal Tour Guide
Ask me questions while you tour the home.