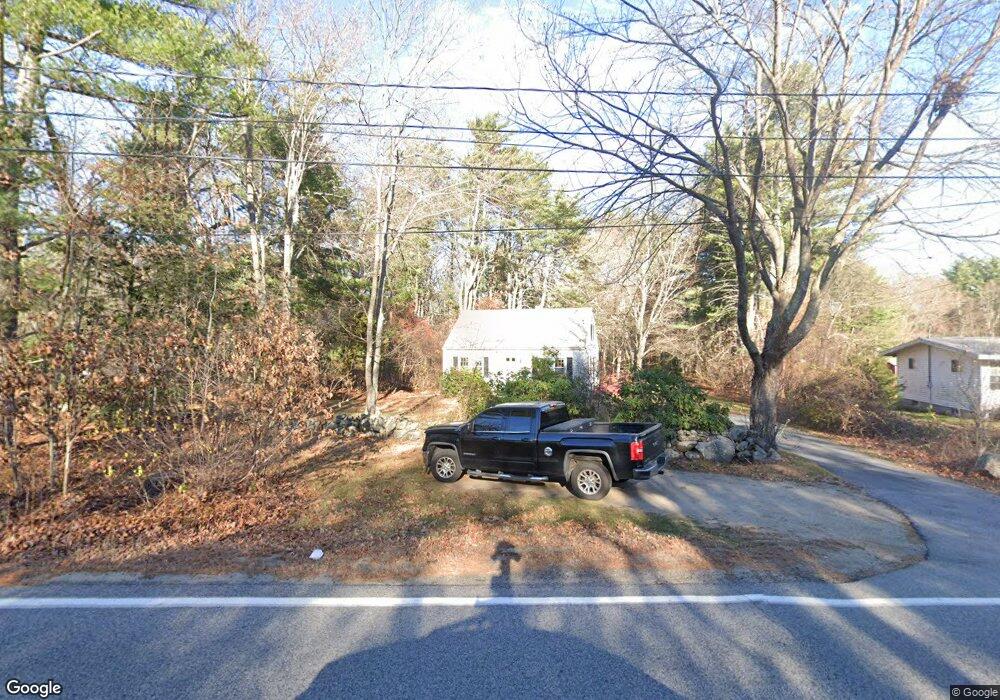
23 Cedar Rd North Hampton, NH 03862
Estimated Value: $456,876 - $529,000
2
Beds
1
Bath
806
Sq Ft
$598/Sq Ft
Est. Value
About This Home
This home is located at 23 Cedar Rd, North Hampton, NH 03862 and is currently estimated at $481,719, approximately $597 per square foot. 23 Cedar Rd is a home with nearby schools including North Hampton School, Winnacunnet High School, and Sacred Heart School.
Ownership History
Date
Name
Owned For
Owner Type
Purchase Details
Closed on
Jan 19, 2024
Sold by
Dorr Ft and Dorr
Bought by
Modzelewski Angela M
Current Estimated Value
Home Financials for this Owner
Home Financials are based on the most recent Mortgage that was taken out on this home.
Original Mortgage
$397,700
Outstanding Balance
$390,845
Interest Rate
7.03%
Mortgage Type
Purchase Money Mortgage
Estimated Equity
$90,874
Create a Home Valuation Report for This Property
The Home Valuation Report is an in-depth analysis detailing your home's value as well as a comparison with similar homes in the area
Home Values in the Area
Average Home Value in this Area
Purchase History
| Date | Buyer | Sale Price | Title Company |
|---|---|---|---|
| Modzelewski Angela M | $410,000 | None Available |
Source: Public Records
Mortgage History
| Date | Status | Borrower | Loan Amount |
|---|---|---|---|
| Open | Modzelewski Angela M | $397,700 |
Source: Public Records
Tax History Compared to Growth
Tax History
| Year | Tax Paid | Tax Assessment Tax Assessment Total Assessment is a certain percentage of the fair market value that is determined by local assessors to be the total taxable value of land and additions on the property. | Land | Improvement |
|---|---|---|---|---|
| 2024 | $4,470 | $349,200 | $180,400 | $168,800 |
| 2023 | $4,348 | $349,200 | $180,400 | $168,800 |
| 2022 | $4,387 | $255,500 | $142,000 | $113,500 |
| 2021 | $4,234 | $255,500 | $142,000 | $113,500 |
| 2020 | $4,321 | $255,500 | $142,000 | $113,500 |
| 2019 | $4,267 | $255,500 | $142,000 | $113,500 |
| 2018 | $4,149 | $255,500 | $142,000 | $113,500 |
| 2017 | $3,563 | $192,600 | $111,300 | $81,300 |
| 2016 | $3,426 | $192,600 | $111,300 | $81,300 |
| 2015 | $3,367 | $192,600 | $111,300 | $81,300 |
| 2014 | $3,284 | $192,600 | $111,300 | $81,300 |
| 2013 | $3,226 | $192,600 | $111,300 | $81,300 |
Source: Public Records
Map
Nearby Homes