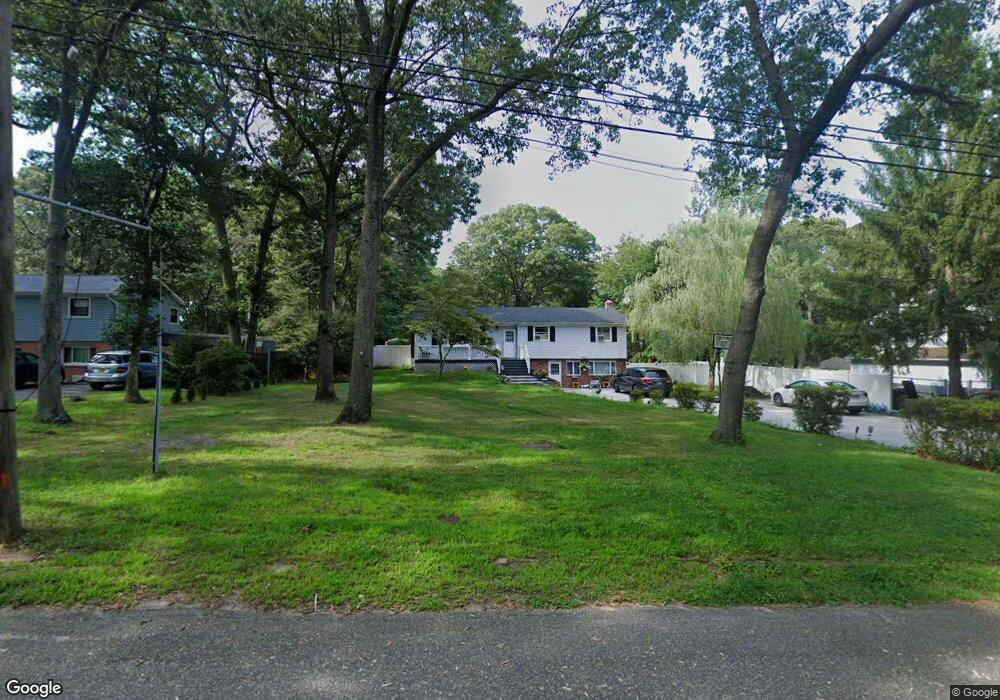
23 Cedar St Selden, NY 11784
Estimated Value: $562,000 - $593,000
3
Beds
2
Baths
1,266
Sq Ft
$458/Sq Ft
Est. Value
About This Home
This home is located at 23 Cedar St, Selden, NY 11784 and is currently estimated at $580,454, approximately $458 per square foot. 23 Cedar St is a home located in Suffolk County.
Ownership History
Date
Name
Owned For
Owner Type
Purchase Details
Closed on
Jan 29, 2015
Sold by
Kinney Eugene J
Bought by
Mccaffrey Patrick W and Mccaffrey Marcela M
Current Estimated Value
Home Financials for this Owner
Home Financials are based on the most recent Mortgage that was taken out on this home.
Original Mortgage
$306,450
Outstanding Balance
$235,925
Interest Rate
3.9%
Mortgage Type
VA
Estimated Equity
$344,529
Purchase Details
Closed on
Dec 20, 2006
Purchase Details
Closed on
Feb 14, 2003
Sold by
Durand James and Durand Dorothy
Bought by
Kinney James J
Home Financials for this Owner
Home Financials are based on the most recent Mortgage that was taken out on this home.
Original Mortgage
$256,000
Interest Rate
5.9%
Purchase Details
Closed on
Oct 6, 1999
Sold by
Schaeperkoetter Steven C and Schaeperkoetter Urlike
Bought by
Durand James and Durand Dorothy
Home Financials for this Owner
Home Financials are based on the most recent Mortgage that was taken out on this home.
Original Mortgage
$150,563
Interest Rate
7.78%
Mortgage Type
FHA
Create a Home Valuation Report for This Property
The Home Valuation Report is an in-depth analysis detailing your home's value as well as a comparison with similar homes in the area
Home Values in the Area
Average Home Value in this Area
Purchase History
| Date | Buyer | Sale Price | Title Company |
|---|---|---|---|
| Mccaffrey Patrick W | $300,000 | None Available | |
| -- | -- | -- | |
| Kinney James J | $320,000 | -- | |
| Durand James | $155,000 | First American Title Ins Co |
Source: Public Records
Mortgage History
| Date | Status | Borrower | Loan Amount |
|---|---|---|---|
| Open | Mccaffrey Patrick W | $306,450 | |
| Previous Owner | Kinney James J | $256,000 | |
| Previous Owner | Durand James | $150,563 |
Source: Public Records
Tax History Compared to Growth
Tax History
| Year | Tax Paid | Tax Assessment Tax Assessment Total Assessment is a certain percentage of the fair market value that is determined by local assessors to be the total taxable value of land and additions on the property. | Land | Improvement |
|---|---|---|---|---|
| 2024 | $6,925 | $2,250 | $200 | $2,050 |
| 2023 | $6,925 | $2,250 | $200 | $2,050 |
| 2022 | $5,583 | $2,250 | $200 | $2,050 |
| 2021 | $5,583 | $2,250 | $200 | $2,050 |
| 2020 | $5,801 | $2,250 | $200 | $2,050 |
| 2019 | $5,801 | $0 | $0 | $0 |
| 2018 | $6,970 | $2,250 | $200 | $2,050 |
| 2017 | $6,970 | $2,250 | $200 | $2,050 |
| 2016 | $6,921 | $2,250 | $200 | $2,050 |
| 2015 | -- | $2,250 | $200 | $2,050 |
| 2014 | -- | $2,250 | $200 | $2,050 |
Source: Public Records
Map
Nearby Homes