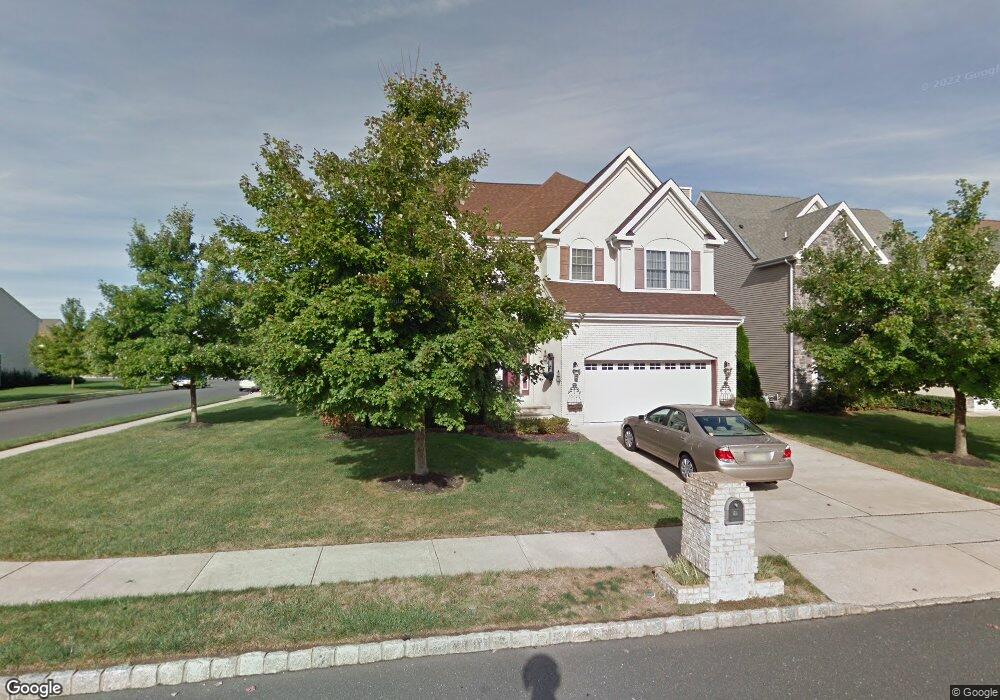
23 Chad Ln Howell, NJ 07731
Adelphia NeighborhoodEstimated Value: $808,648 - $872,000
4
Beds
2
Baths
3,020
Sq Ft
$276/Sq Ft
Est. Value
About This Home
This home is located at 23 Chad Ln, Howell, NJ 07731 and is currently estimated at $832,662, approximately $275 per square foot. 23 Chad Ln is a home located in Monmouth County with nearby schools including Griebling School, Howell Township Memorial Elementary School, and Howell Middle School North.
Ownership History
Date
Name
Owned For
Owner Type
Purchase Details
Closed on
Aug 23, 2004
Sold by
Jrc At Fort Plains Road Llc
Bought by
Moshett Trevor and Moshett Karla
Current Estimated Value
Home Financials for this Owner
Home Financials are based on the most recent Mortgage that was taken out on this home.
Original Mortgage
$220,000
Outstanding Balance
$107,717
Interest Rate
5.81%
Estimated Equity
$724,945
Create a Home Valuation Report for This Property
The Home Valuation Report is an in-depth analysis detailing your home's value as well as a comparison with similar homes in the area
Home Values in the Area
Average Home Value in this Area
Purchase History
| Date | Buyer | Sale Price | Title Company |
|---|---|---|---|
| Moshett Trevor | $418,000 | -- |
Source: Public Records
Mortgage History
| Date | Status | Borrower | Loan Amount |
|---|---|---|---|
| Open | Moshett Trevor | $220,000 |
Source: Public Records
Tax History Compared to Growth
Tax History
| Year | Tax Paid | Tax Assessment Tax Assessment Total Assessment is a certain percentage of the fair market value that is determined by local assessors to be the total taxable value of land and additions on the property. | Land | Improvement |
|---|---|---|---|---|
| 2025 | $12,259 | $763,500 | $308,800 | $454,700 |
| 2024 | $12,220 | $700,900 | $248,800 | $452,100 |
| 2023 | $12,220 | $667,400 | $223,800 | $443,600 |
| 2022 | $11,808 | $586,800 | $148,800 | $438,000 |
| 2021 | $11,808 | $523,400 | $133,800 | $389,600 |
| 2020 | $11,720 | $513,600 | $123,800 | $389,800 |
| 2019 | $11,916 | $511,400 | $123,800 | $387,600 |
| 2018 | $11,134 | $475,200 | $101,300 | $373,900 |
| 2017 | $11,179 | $472,100 | $101,300 | $370,800 |
| 2016 | $11,112 | $462,800 | $101,300 | $361,500 |
| 2015 | $11,404 | $469,900 | $113,800 | $356,100 |
| 2014 | $11,094 | $421,200 | $128,800 | $292,400 |
Source: Public Records
Map
Nearby Homes