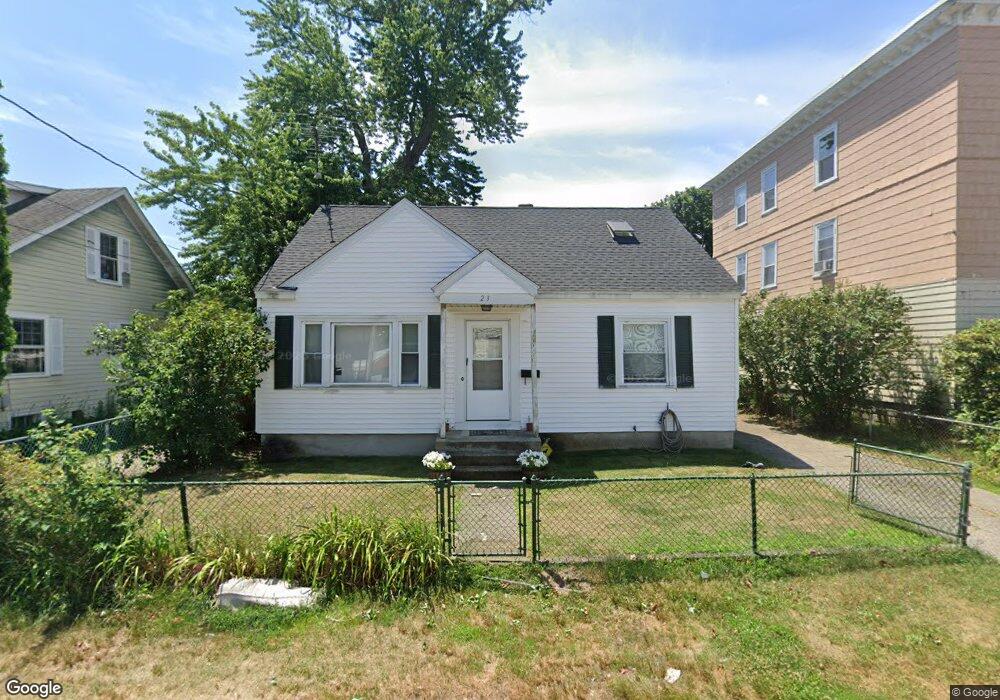
23 Chaplin St Pawtucket, RI 02861
Darlington NeighborhoodEstimated Value: $384,000 - $426,000
3
Beds
1
Bath
1,836
Sq Ft
$219/Sq Ft
Est. Value
About This Home
This home is located at 23 Chaplin St, Pawtucket, RI 02861 and is currently estimated at $402,215, approximately $219 per square foot. 23 Chaplin St is a home located in Providence County with nearby schools including St Cecilia School and Saint Raphael Academy.
Ownership History
Date
Name
Owned For
Owner Type
Purchase Details
Closed on
Nov 15, 2002
Sold by
Shah Rajesh D and Shah Rupal R
Bought by
Cendant Mobl Fncl Corp
Current Estimated Value
Purchase Details
Closed on
Feb 26, 1999
Sold by
Macartney Joseph H and Macartney Karen
Bought by
Lacombe Gary J
Purchase Details
Closed on
May 1, 1995
Sold by
Plante Tr Bernice M
Bought by
Macartney Joseph H and Macartney Karen
Create a Home Valuation Report for This Property
The Home Valuation Report is an in-depth analysis detailing your home's value as well as a comparison with similar homes in the area
Home Values in the Area
Average Home Value in this Area
Purchase History
| Date | Buyer | Sale Price | Title Company |
|---|---|---|---|
| Cendant Mobl Fncl Corp | $309,000 | -- | |
| Lacombe Gary J | $92,000 | -- | |
| Macartney Joseph H | $80,000 | -- |
Source: Public Records
Mortgage History
| Date | Status | Borrower | Loan Amount |
|---|---|---|---|
| Open | Macartney Joseph H | $175,315 | |
| Closed | Macartney Joseph H | $175,315 | |
| Closed | Macartney Joseph H | $163,000 |
Source: Public Records
Tax History
| Year | Tax Paid | Tax Assessment Tax Assessment Total Assessment is a certain percentage of the fair market value that is determined by local assessors to be the total taxable value of land and additions on the property. | Land | Improvement |
|---|---|---|---|---|
| 2025 | $3,820 | $290,500 | $122,900 | $167,600 |
| 2024 | $3,585 | $290,500 | $122,900 | $167,600 |
| 2023 | $3,723 | $219,800 | $76,900 | $142,900 |
| 2022 | $3,644 | $219,800 | $76,900 | $142,900 |
| 2021 | $3,644 | $219,800 | $76,900 | $142,900 |
| 2020 | $3,497 | $167,400 | $60,700 | $106,700 |
| 2019 | $3,497 | $167,400 | $60,700 | $106,700 |
| 2018 | $3,370 | $167,400 | $60,700 | $106,700 |
| 2017 | $3,233 | $142,300 | $49,700 | $92,600 |
| 2016 | $3,115 | $142,300 | $49,700 | $92,600 |
| 2015 | $3,115 | $142,300 | $49,700 | $92,600 |
| 2014 | $3,224 | $139,800 | $49,700 | $90,100 |
Source: Public Records
Map
Nearby Homes
Your Personal Tour Guide
Ask me questions while you tour the home.