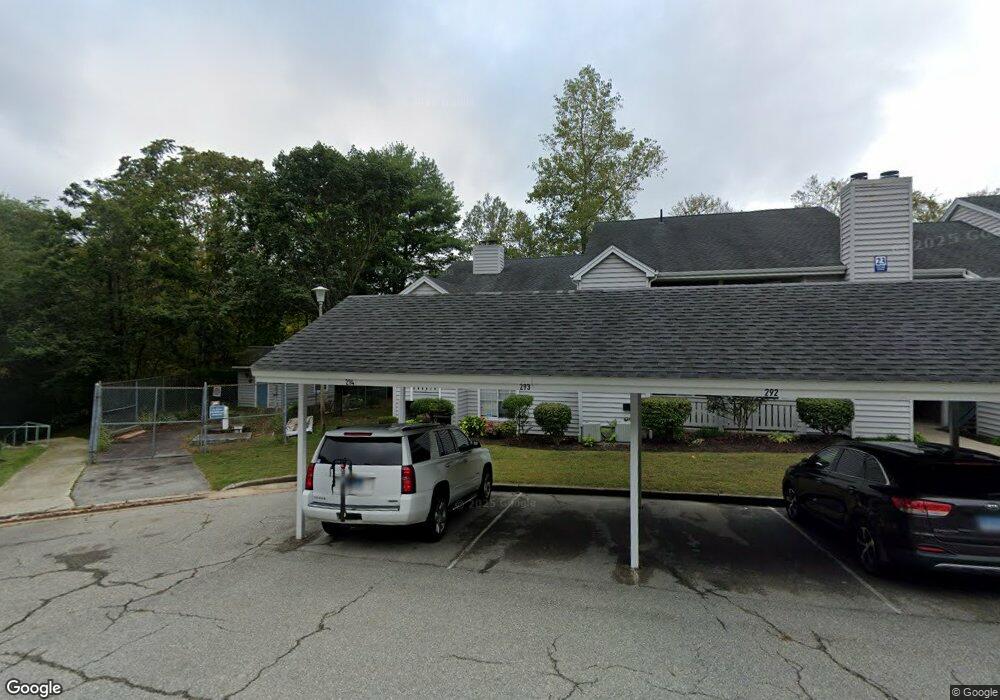
23 Chase Oak Ct Unit 9 Groton, CT 06340
Estimated Value: $210,143 - $222,000
1
Bed
1
Bath
844
Sq Ft
$257/Sq Ft
Est. Value
About This Home
This home is located at 23 Chase Oak Ct Unit 9, Groton, CT 06340 and is currently estimated at $217,036, approximately $257 per square foot. 23 Chase Oak Ct Unit 9 is a home located in New London County with nearby schools including Claude Chester School, Groton Middle School, and Robert E. Fitch High School.
Ownership History
Date
Name
Owned For
Owner Type
Purchase Details
Closed on
Mar 7, 2005
Sold by
Caputo Marilyn
Bought by
Nelson Lori
Current Estimated Value
Home Financials for this Owner
Home Financials are based on the most recent Mortgage that was taken out on this home.
Original Mortgage
$100,000
Outstanding Balance
$50,865
Interest Rate
5.66%
Estimated Equity
$166,171
Purchase Details
Closed on
Oct 13, 2000
Sold by
Heckendorn Eileen M and Gaynor Beverly J
Bought by
Caputo Marilyn C
Home Financials for this Owner
Home Financials are based on the most recent Mortgage that was taken out on this home.
Original Mortgage
$68,400
Interest Rate
7.89%
Purchase Details
Closed on
May 28, 1997
Sold by
Acqui Spy Glass Hollow
Bought by
Heckendorn Eileen M
Home Financials for this Owner
Home Financials are based on the most recent Mortgage that was taken out on this home.
Original Mortgage
$47,200
Interest Rate
8.09%
Mortgage Type
Unknown
Create a Home Valuation Report for This Property
The Home Valuation Report is an in-depth analysis detailing your home's value as well as a comparison with similar homes in the area
Home Values in the Area
Average Home Value in this Area
Purchase History
| Date | Buyer | Sale Price | Title Company |
|---|---|---|---|
| Nelson Lori | $129,500 | -- | |
| Caputo Marilyn C | $72,000 | -- | |
| Heckendorn Eileen M | $67,500 | -- |
Source: Public Records
Mortgage History
| Date | Status | Borrower | Loan Amount |
|---|---|---|---|
| Open | Heckendorn Eileen M | $100,000 | |
| Previous Owner | Heckendorn Eileen M | $68,400 | |
| Previous Owner | Heckendorn Eileen M | $47,200 |
Source: Public Records
Tax History Compared to Growth
Tax History
| Year | Tax Paid | Tax Assessment Tax Assessment Total Assessment is a certain percentage of the fair market value that is determined by local assessors to be the total taxable value of land and additions on the property. | Land | Improvement |
|---|---|---|---|---|
| 2025 | $2,413 | $81,760 | $24,528 | $57,232 |
| 2024 | $2,271 | $81,760 | $24,528 | $57,232 |
| 2023 | $2,226 | $81,760 | $0 | $81,760 |
| 2022 | $2,175 | $81,760 | $0 | $81,760 |
| 2021 | $2,032 | $62,580 | $0 | $62,580 |
| 2020 | $1,979 | $62,580 | $0 | $62,580 |
| 2019 | $1,906 | $62,580 | $0 | $62,580 |
| 2018 | $1,886 | $62,580 | $0 | $62,580 |
| 2017 | $1,837 | $62,580 | $0 | $62,580 |
| 2016 | $2,636 | $93,870 | $0 | $93,870 |
| 2015 | $2,534 | $93,870 | $0 | $93,870 |
| 2014 | $2,467 | $93,870 | $0 | $93,870 |
Source: Public Records
Map
Nearby Homes
- 205 Winding Hollow Rd
- 83 Leafwood Ln Unit 227
- 517-571 Gold Star Hwy
- 58 Plymouth Ave S
- 109 Valley Rd
- 411 Long Hill Rd
- 22 Toll Gate Rd
- 301 Buddington Rd Unit LOT 64
- 351 Flanders Rd
- 140 Laurelwood Rd
- 130 Meridian St Unit 313
- 136 Meridian St Unit 110
- 91 Buddington Rd Unit LOT 53
- 181 Mirra Dr
- 21 Grove Ave
- 62 Slocomb Terrace
- 297 Lestertown Rd
- 97 North Rd
- 132 Thames St Unit R
- 214 Poquonnock Rd
- 23 Chase Oak Ct Unit 19
- 23 Chase Oak Ct Unit 15
- 23 Chase Oak Ct Unit 20
- 23 Chase Oak Ct Unit 17
- 23 Chase Oak Ct Unit 14
- 23 Chase Oak Ct Unit 10
- 23 Chase Oak Ct Unit 18
- 23 Chase Oak Ct Unit 12
- 23 Chase Oak Ct Unit 11
- 23 Chase Oak Ct
- 23 Chase Oaks Ct Unit 15
- 9 Chase Oak Ct Unit 4
- 9 Chase Oak Ct Unit 2
- 9 Chase Oak Ct Unit 6
- 9 Chase Oak Ct Unit 8
- 9 Chase Oak Ct Unit 7
- 9 Chase Oak Ct Unit 5
- 9 Chase Oak Ct Unit 3
- 9 Chase Oak Ct Unit 1
- 9 Chase Oak Ct