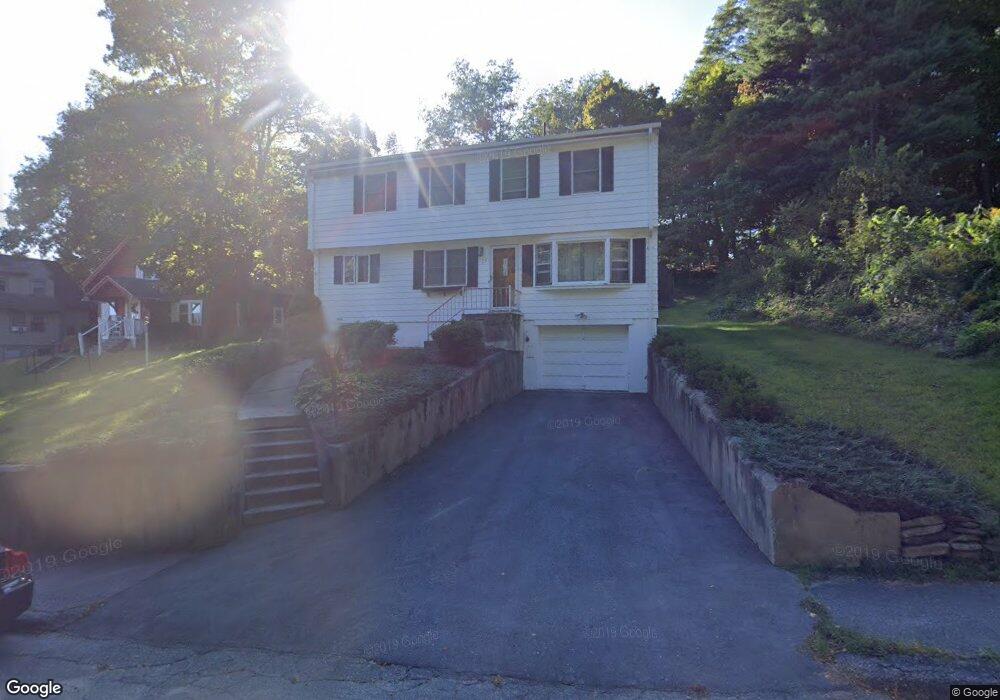
23 Chesterfield Rd Worcester, MA 01602
West Tatnuck NeighborhoodEstimated Value: $472,000 - $555,000
3
Beds
3
Baths
1,778
Sq Ft
$285/Sq Ft
Est. Value
About This Home
This home is located at 23 Chesterfield Rd, Worcester, MA 01602 and is currently estimated at $507,180, approximately $285 per square foot. 23 Chesterfield Rd is a home located in Worcester County with nearby schools including Tatnuck Magnet School, Chandler Magnet, and Jacob Hiatt Magnet School.
Ownership History
Date
Name
Owned For
Owner Type
Purchase Details
Closed on
Mar 15, 2006
Sold by
Time Mortgage Co Llc
Bought by
Osafo-Konadu Jane and Osafo-Konadu Rexford
Current Estimated Value
Home Financials for this Owner
Home Financials are based on the most recent Mortgage that was taken out on this home.
Original Mortgage
$200,000
Interest Rate
6.27%
Mortgage Type
Purchase Money Mortgage
Purchase Details
Closed on
Dec 30, 1999
Sold by
Bessette Armand P and Bessette Judith A
Bought by
Conlon Matthew J and Conlon Lori L
Home Financials for this Owner
Home Financials are based on the most recent Mortgage that was taken out on this home.
Original Mortgage
$140,400
Interest Rate
7.71%
Mortgage Type
Purchase Money Mortgage
Create a Home Valuation Report for This Property
The Home Valuation Report is an in-depth analysis detailing your home's value as well as a comparison with similar homes in the area
Home Values in the Area
Average Home Value in this Area
Purchase History
| Date | Buyer | Sale Price | Title Company |
|---|---|---|---|
| Osafo-Konadu Jane | $280,000 | -- | |
| Conlon Matthew J | $156,000 | -- |
Source: Public Records
Mortgage History
| Date | Status | Borrower | Loan Amount |
|---|---|---|---|
| Open | Conlon Matthew J | $196,000 | |
| Closed | Conlon Matthew J | $197,000 | |
| Closed | Osafo-Konadu Jane | $200,000 | |
| Previous Owner | Conlon Matthew J | $20,000 | |
| Previous Owner | Conlon Matthew J | $140,400 |
Source: Public Records
Tax History Compared to Growth
Tax History
| Year | Tax Paid | Tax Assessment Tax Assessment Total Assessment is a certain percentage of the fair market value that is determined by local assessors to be the total taxable value of land and additions on the property. | Land | Improvement |
|---|---|---|---|---|
| 2025 | $5,116 | $387,900 | $119,200 | $268,700 |
| 2024 | $5,023 | $365,300 | $119,200 | $246,100 |
| 2023 | $4,813 | $335,600 | $103,600 | $232,000 |
| 2022 | $4,426 | $291,000 | $82,900 | $208,100 |
| 2021 | $4,394 | $269,900 | $66,300 | $203,600 |
| 2020 | $4,264 | $250,800 | $66,200 | $184,600 |
| 2019 | $4,111 | $228,400 | $59,800 | $168,600 |
| 2018 | $4,092 | $216,400 | $59,800 | $156,600 |
| 2017 | $3,942 | $205,100 | $59,800 | $145,300 |
| 2016 | $3,912 | $189,800 | $44,900 | $144,900 |
| 2015 | $3,809 | $189,800 | $44,900 | $144,900 |
| 2014 | $3,709 | $189,800 | $44,900 | $144,900 |
Source: Public Records
Map
Nearby Homes
- 12 Copperfield Rd
- 1029 Pleasant St Unit 19
- 23 Fenton Dr
- 806 Pleasant St
- 12 Merlin Ct
- 40 Rustic Dr
- 40 Walter St
- 6 Moore Ave
- 980 Pleasant St
- 20 Manhattan Rd
- 125 Mower St
- 28 Cascade Rd
- 5 Forest Hill Dr
- 17 Orrison St
- 9 Newburn Rd
- 148A Tory Fort Ln
- 22 Audubon Rd
- 47R Yarnie Unit 3B
- 47R Yarnie Unit 3A
- 47R Yarnie Unit 1B
- 17 Chesterfield Rd
- 27 Chesterfield Rd
- 15 Chesterfield Rd
- 15 Chesterfield Rd Unit 1
- 74 Copperfield Rd
- 76 Copperfield Rd
- 64 Copperfield Rd
- 78 Copperfield Rd
- 78 Copperfield Rd
- 31 Chesterfield Rd
- 80 Copperfield Rd
- 11 Chesterfield Rd
- 60 Copperfield Rd
- 56 Copperfield Rd
- 33 Chesterfield Rd
- 10 Chesterfield Rd
- 9 Chesterfield Rd
- 84 Copperfield Rd
- 84 Copperfield Rd Unit 3
- 52 Copperfield Rd