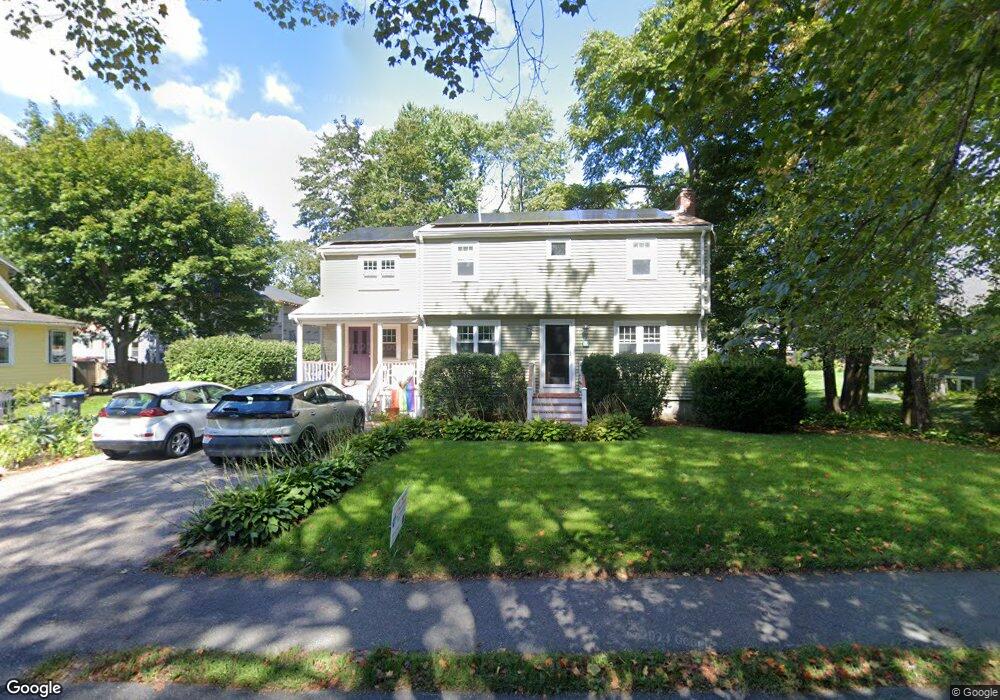
23 Curve St Natick, MA 01760
Estimated Value: $972,000 - $1,049,000
4
Beds
3
Baths
2,173
Sq Ft
$469/Sq Ft
Est. Value
About This Home
This home is located at 23 Curve St, Natick, MA 01760 and is currently estimated at $1,019,378, approximately $469 per square foot. 23 Curve St is a home located in Middlesex County with nearby schools including Natick High School, Johnson Elementary School, and J F Kennedy Middle School.
Ownership History
Date
Name
Owned For
Owner Type
Purchase Details
Closed on
Jul 28, 2000
Sold by
Obrien-Byron Faye
Bought by
Margil David S and Freedman Jodi S
Current Estimated Value
Home Financials for this Owner
Home Financials are based on the most recent Mortgage that was taken out on this home.
Original Mortgage
$247,000
Interest Rate
8.18%
Mortgage Type
Purchase Money Mortgage
Create a Home Valuation Report for This Property
The Home Valuation Report is an in-depth analysis detailing your home's value as well as a comparison with similar homes in the area
Home Values in the Area
Average Home Value in this Area
Purchase History
| Date | Buyer | Sale Price | Title Company |
|---|---|---|---|
| Margil David S | $340,000 | -- |
Source: Public Records
Mortgage History
| Date | Status | Borrower | Loan Amount |
|---|---|---|---|
| Open | Margil David S | $225,000 | |
| Closed | Margil David S | $266,200 | |
| Closed | Margil David S | $247,000 |
Source: Public Records
Tax History
| Year | Tax Paid | Tax Assessment Tax Assessment Total Assessment is a certain percentage of the fair market value that is determined by local assessors to be the total taxable value of land and additions on the property. | Land | Improvement |
|---|---|---|---|---|
| 2025 | $10,796 | $902,700 | $454,500 | $448,200 |
| 2024 | $10,379 | $846,600 | $429,300 | $417,300 |
| 2023 | $10,158 | $803,600 | $403,600 | $400,000 |
| 2022 | $9,916 | $743,300 | $368,000 | $375,300 |
| 2021 | $9,489 | $697,200 | $347,800 | $349,400 |
| 2020 | $9,077 | $666,900 | $317,500 | $349,400 |
| 2019 | $8,476 | $666,900 | $317,500 | $349,400 |
| 2018 | $8,318 | $637,400 | $302,400 | $335,000 |
| 2017 | $8,055 | $597,100 | $268,000 | $329,100 |
| 2016 | $7,860 | $579,200 | $253,000 | $326,200 |
| 2015 | $7,627 | $551,900 | $253,000 | $298,900 |
Source: Public Records
Map
Nearby Homes
- 25 Forest Ave
- 6 Floral Avenue Extension
- 12 Floral Ave
- 5 Reynolds Ave Unit 2
- 216-218 S Main St
- 14 Pinewood Ave
- 62 Oakland St
- 16 West St
- 63 Pond St
- 7 High St
- 89 W Central St
- 49 Summer St
- 45 Summer St
- 11 Avon St
- 9 Bellevue Rd
- 10 Lincoln St Unit 10
- 6A Lincoln St Unit 6A
- 4B Lincoln St Unit 4B
- 3A Wilson St Unit 3A
- 3 Wilson St Unit 3B
Your Personal Tour Guide
Ask me questions while you tour the home.