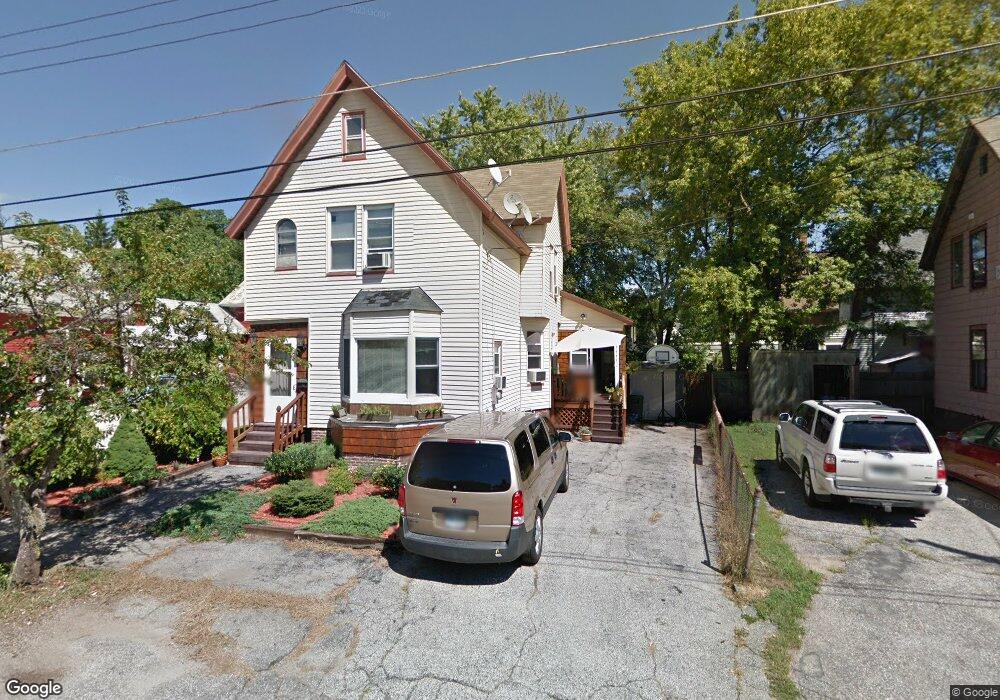
23 Dakin St Concord, NH 03301
South End NeighborhoodEstimated Value: $399,000 - $479,000
2
Beds
2
Baths
1,564
Sq Ft
$280/Sq Ft
Est. Value
About This Home
This home is located at 23 Dakin St, Concord, NH 03301 and is currently estimated at $437,587, approximately $279 per square foot. 23 Dakin St is a home located in Merrimack County with nearby schools including Abbot-Downing School, Rundlett Middle School, and Concord High School.
Ownership History
Date
Name
Owned For
Owner Type
Purchase Details
Closed on
Mar 27, 2000
Sold by
Rivet Frank R and Rivet Theresa A
Bought by
Nehma Joseph N
Current Estimated Value
Home Financials for this Owner
Home Financials are based on the most recent Mortgage that was taken out on this home.
Original Mortgage
$94,500
Outstanding Balance
$32,562
Interest Rate
8.31%
Mortgage Type
Purchase Money Mortgage
Estimated Equity
$405,025
Create a Home Valuation Report for This Property
The Home Valuation Report is an in-depth analysis detailing your home's value as well as a comparison with similar homes in the area
Home Values in the Area
Average Home Value in this Area
Purchase History
| Date | Buyer | Sale Price | Title Company |
|---|---|---|---|
| Nehma Joseph N | $99,500 | -- |
Source: Public Records
Mortgage History
| Date | Status | Borrower | Loan Amount |
|---|---|---|---|
| Open | Nehma Joseph N | $94,500 |
Source: Public Records
Tax History Compared to Growth
Tax History
| Year | Tax Paid | Tax Assessment Tax Assessment Total Assessment is a certain percentage of the fair market value that is determined by local assessors to be the total taxable value of land and additions on the property. | Land | Improvement |
|---|---|---|---|---|
| 2024 | $6,676 | $241,100 | $101,900 | $139,200 |
| 2023 | $6,476 | $241,100 | $101,900 | $139,200 |
| 2022 | $6,242 | $241,100 | $101,900 | $139,200 |
| 2021 | $6,092 | $242,500 | $101,900 | $140,600 |
| 2020 | $5,951 | $222,400 | $85,100 | $137,300 |
| 2019 | $5,745 | $206,800 | $83,800 | $123,000 |
| 2018 | $5,345 | $189,600 | $80,500 | $109,100 |
| 2017 | $5,092 | $180,300 | $79,000 | $101,300 |
| 2016 | $4,804 | $173,600 | $79,000 | $94,600 |
| 2015 | $4,596 | $164,300 | $71,800 | $92,500 |
| 2014 | $4,405 | $164,300 | $71,800 | $92,500 |
| 2013 | -- | $163,400 | $71,800 | $91,600 |
| 2012 | -- | $171,300 | $71,800 | $99,500 |
Source: Public Records
Map
Nearby Homes
- 33 Spruce St
- 24 Badger St
- 0 Spruce St Unit 88
- 105 S Main St
- 14 Downing St
- 12 Avon St
- 122 South St
- 14-16 Perley St
- 75 S State St
- 47 South St
- 10 Perley St
- 87 S Main St Unit 2
- 0 South St Unit 4969509
- 4 Fayette St
- 54 Pleasant St Unit 8
- 15 Wilson Ave
- 22 Wilson Ave
- 376 S Main St
- 22 Longmeadow Dr
- 41 Longmeadow Dr