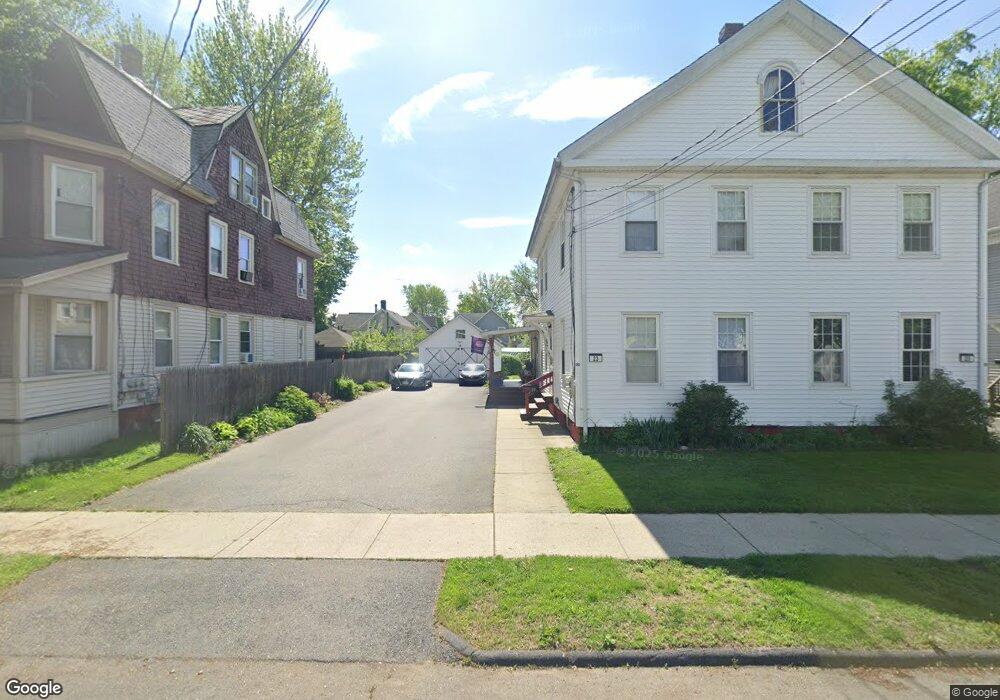
23 Day St West Springfield, MA 01089
Estimated Value: $338,097 - $402,000
4
Beds
2
Baths
2,465
Sq Ft
$153/Sq Ft
Est. Value
About This Home
This home is located at 23 Day St, West Springfield, MA 01089 and is currently estimated at $377,774, approximately $153 per square foot. 23 Day St is a home located in Hampden County with nearby schools including West Springfield High School and Hampden Charter School of Science West.
Ownership History
Date
Name
Owned For
Owner Type
Purchase Details
Closed on
Feb 15, 2011
Sold by
Savides Melissa R
Bought by
Grundy Nelson J
Current Estimated Value
Purchase Details
Closed on
May 14, 2010
Sold by
Grundy Nelson J
Bought by
Savides Melissa R
Create a Home Valuation Report for This Property
The Home Valuation Report is an in-depth analysis detailing your home's value as well as a comparison with similar homes in the area
Home Values in the Area
Average Home Value in this Area
Purchase History
| Date | Buyer | Sale Price | Title Company |
|---|---|---|---|
| Grundy Nelson J | -- | -- | |
| Savides Melissa R | -- | -- |
Source: Public Records
Tax History Compared to Growth
Tax History
| Year | Tax Paid | Tax Assessment Tax Assessment Total Assessment is a certain percentage of the fair market value that is determined by local assessors to be the total taxable value of land and additions on the property. | Land | Improvement |
|---|---|---|---|---|
| 2025 | $4,318 | $290,400 | $95,800 | $194,600 |
| 2024 | $4,301 | $290,400 | $95,800 | $194,600 |
| 2023 | $3,852 | $247,900 | $86,100 | $161,800 |
| 2022 | $3,756 | $238,300 | $78,200 | $160,100 |
| 2021 | $3,233 | $191,300 | $72,200 | $119,100 |
| 2020 | $3,250 | $191,300 | $72,200 | $119,100 |
| 2019 | $3,244 | $191,300 | $72,200 | $119,100 |
| 2018 | $3,262 | $191,300 | $72,200 | $119,100 |
| 2017 | $3,262 | $191,300 | $72,200 | $119,100 |
| 2016 | $3,203 | $188,500 | $69,400 | $119,100 |
| 2015 | $3,187 | $187,600 | $68,000 | $119,600 |
| 2014 | $773 | $187,600 | $68,000 | $119,600 |
Source: Public Records
Map
Nearby Homes