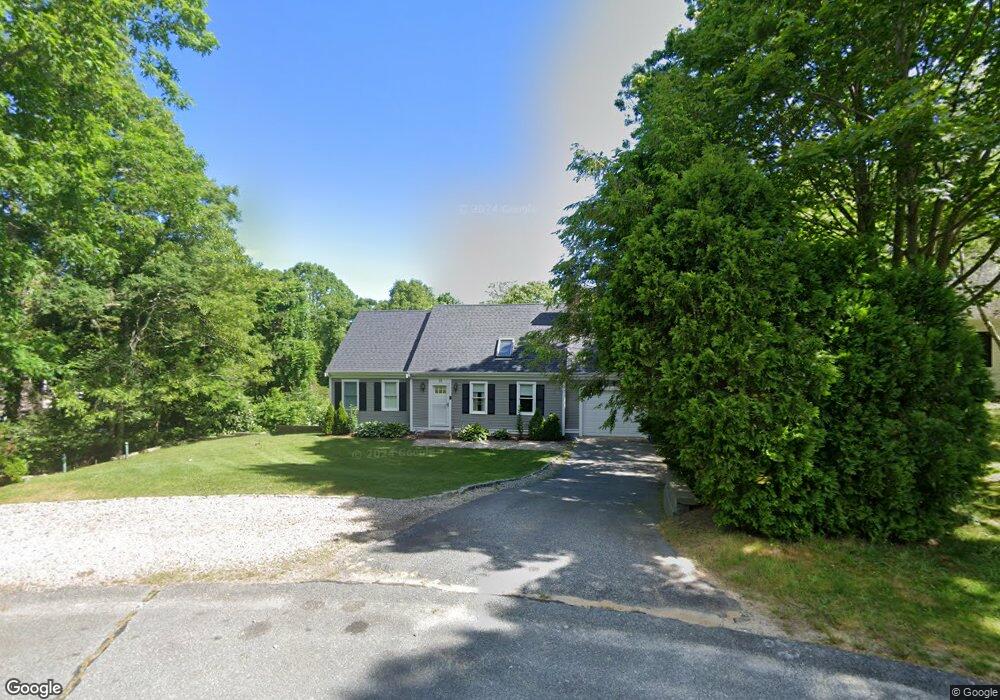
23 Derby Dr West Barnstable, MA 02668
West Barnstable NeighborhoodEstimated Value: $598,431 - $670,000
3
Beds
2
Baths
1,104
Sq Ft
$575/Sq Ft
Est. Value
About This Home
This home is located at 23 Derby Dr, West Barnstable, MA 02668 and is currently estimated at $634,358, approximately $574 per square foot. 23 Derby Dr is a home located in Barnstable County with nearby schools including Barnstable United Elementary School, West Barnstable Elementary School, and Barnstable Intermediate School.
Ownership History
Date
Name
Owned For
Owner Type
Purchase Details
Closed on
Sep 13, 2017
Sold by
Merrill Janice
Bought by
Costa Hercules
Current Estimated Value
Home Financials for this Owner
Home Financials are based on the most recent Mortgage that was taken out on this home.
Original Mortgage
$202,000
Outstanding Balance
$166,380
Interest Rate
3.93%
Mortgage Type
New Conventional
Estimated Equity
$467,978
Purchase Details
Closed on
May 20, 2014
Sold by
Merrill Janice and Smith Daniel F
Bought by
Merrill Janice
Purchase Details
Closed on
Sep 9, 1994
Sold by
Fhlmc
Bought by
Smith Daniel
Purchase Details
Closed on
Feb 16, 1994
Sold by
Muth Richard and Muth Dawn Marie
Bought by
Fhlmc
Purchase Details
Closed on
May 9, 1989
Sold by
Sollows Richard
Bought by
Muth Richard
Create a Home Valuation Report for This Property
The Home Valuation Report is an in-depth analysis detailing your home's value as well as a comparison with similar homes in the area
Home Values in the Area
Average Home Value in this Area
Purchase History
| Date | Buyer | Sale Price | Title Company |
|---|---|---|---|
| Costa Hercules | $252,500 | -- | |
| Merrill Janice | -- | -- | |
| Smith Daniel | $110,500 | -- | |
| Fhlmc | $116,000 | -- | |
| Muth Richard | $169,000 | -- | |
| Muth Richard O | $169,000 | -- |
Source: Public Records
Mortgage History
| Date | Status | Borrower | Loan Amount |
|---|---|---|---|
| Open | Costa Hercules | $202,000 | |
| Previous Owner | Muth Richard O | $21,500 | |
| Previous Owner | Muth Richard O | $164,000 | |
| Previous Owner | Muth Richard O | $164,000 |
Source: Public Records
Tax History
| Year | Tax Paid | Tax Assessment Tax Assessment Total Assessment is a certain percentage of the fair market value that is determined by local assessors to be the total taxable value of land and additions on the property. | Land | Improvement |
|---|---|---|---|---|
| 2025 | $4,960 | $531,100 | $175,500 | $355,600 |
| 2024 | $4,388 | $511,400 | $175,500 | $335,900 |
| 2023 | $4,346 | $477,100 | $173,400 | $303,700 |
| 2022 | $4,328 | $389,600 | $123,300 | $266,300 |
| 2021 | $4,040 | $344,700 | $123,300 | $221,400 |
| 2020 | $4,008 | $330,700 | $123,300 | $207,400 |
| 2019 | $3,818 | $310,900 | $123,300 | $187,600 |
| 2018 | $3,700 | $298,600 | $135,200 | $163,400 |
| 2017 | $3,573 | $291,900 | $135,200 | $156,700 |
| 2016 | $3,513 | $293,000 | $136,300 | $156,700 |
| 2015 | $3,383 | $282,900 | $132,100 | $150,800 |
Source: Public Records
Map
Nearby Homes
- 16 Morgan Way
- 29 Appaloosa Way
- 74 Saddler Ln
- 282 Parker Rd
- 324 Patriot Way
- 84 White Birch Way
- 80 Branch Terrace
- 367 Plum St
- 350 Plum St
- 23 Captain Baker Rd
- 89 Moco Rd
- 37 Ansel Howland Rd
- 900 Old Stage Rd
- 169 Cedric Rd
- 52 Windlass Ln
- 436 Nye Rd
- 117 Elijah Childs Ln
- 27 White Cap Ln
- 66 Tern Ln
- 73 Tern Ln
- 238 Saddler Ln
- 25 Derby Dr
- 224 Saddler Ln
- 28 Derby Dr
- 10 Trotting Bred Ln
- 22 Derby Dr
- 8 Derby Dr
- 229 Saddler Ln
- 253 Saddler Ln
- 221 Saddler Ln
- 196 Saddler Ln
- 215 Saddler Ln
- 20 Trottingbred Ln
- 20 Trotting Bred Ln
- 23 Trotting Bred Ln
- 26 Morgan Way
- 23 Trottingbred Ln
- 23 Trottingbred Ln
- 30 Morgan Way
- 8 Currycomb Cir
Your Personal Tour Guide
Ask me questions while you tour the home.