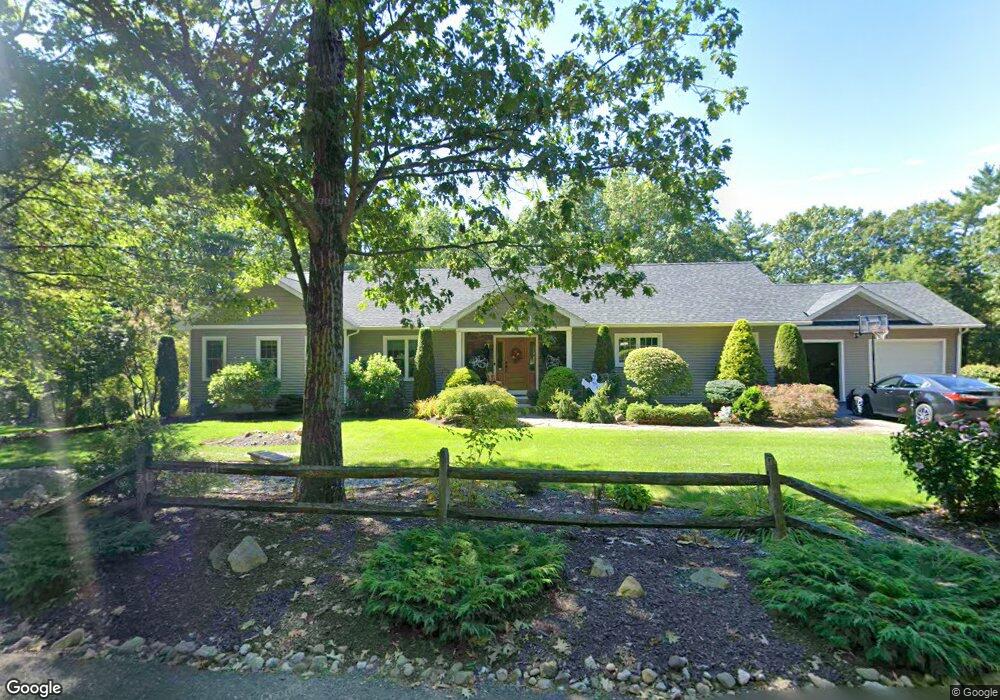
23 Drury Ln Easthampton, MA 01027
Estimated Value: $617,000 - $695,176
3
Beds
2
Baths
2,256
Sq Ft
$293/Sq Ft
Est. Value
About This Home
This home is located at 23 Drury Ln, Easthampton, MA 01027 and is currently estimated at $660,544, approximately $292 per square foot. 23 Drury Ln is a home with nearby schools including Easthampton High School, Calvary Baptist Christian School, and The Williston Northampton School.
Ownership History
Date
Name
Owned For
Owner Type
Purchase Details
Closed on
Oct 28, 2025
Sold by
Campbell Dennis P and Campbell Cheryle A
Bought by
Lavelle Justin M and Campbell Douglas M
Current Estimated Value
Purchase Details
Closed on
Oct 18, 2019
Sold by
Crescione Lt
Bought by
Campbell Cheryle A and Piponidis Georgette
Purchase Details
Closed on
Jan 13, 2014
Sold by
Crescione Lt and Crescione
Bought by
Campbell Cheryle A and Campbell Dennis P
Purchase Details
Closed on
Dec 2, 1974
Bought by
Campbell Cheryle A and Campbell Dennis P
Create a Home Valuation Report for This Property
The Home Valuation Report is an in-depth analysis detailing your home's value as well as a comparison with similar homes in the area
Home Values in the Area
Average Home Value in this Area
Purchase History
| Date | Buyer | Sale Price | Title Company |
|---|---|---|---|
| Lavelle Justin M | -- | -- | |
| Campbell Cheryle A | -- | None Available | |
| Campbell Cheryle A | -- | -- | |
| Campbell Cheryle A | -- | -- |
Source: Public Records
Tax History Compared to Growth
Tax History
| Year | Tax Paid | Tax Assessment Tax Assessment Total Assessment is a certain percentage of the fair market value that is determined by local assessors to be the total taxable value of land and additions on the property. | Land | Improvement |
|---|---|---|---|---|
| 2025 | $8,525 | $623,600 | $117,000 | $506,600 |
| 2024 | $8,230 | $606,900 | $113,400 | $493,500 |
| 2023 | $6,018 | $410,800 | $83,700 | $327,100 |
| 2022 | $6,791 | $410,800 | $83,700 | $327,100 |
| 2021 | $7,607 | $433,700 | $90,100 | $343,600 |
| 2020 | $7,296 | $410,800 | $83,700 | $327,100 |
| 2019 | $6,144 | $397,400 | $83,700 | $313,700 |
| 2018 | $5,853 | $365,800 | $79,100 | $286,700 |
| 2017 | $5,716 | $352,600 | $76,000 | $276,600 |
| 2016 | $5,586 | $358,300 | $76,000 | $282,300 |
| 2015 | $1,151 | $76,000 | $76,000 | $0 |
Source: Public Records
Map
Nearby Homes
- 2 Mine Rd
- 6 Nicols Way Unit 6
- 18 Nicols Way Unit 18
- 12 Nicols Way Unit 12
- 75 Lead Mine Rd
- 262 Loudville Rd
- 1260 Westhampton Rd
- 200 Easthampton Rd
- 36 Torrey St
- 0 Glendale Rd
- 832 Westhampton Rd
- 0 W Farms Rd
- 5 Laurin Ln
- 98 Park Hill Rd
- 72 Glendale Rd
- 29 Rattle Hill Rd
- 10 Golden Cir
- 12 Golden Cir
- 12 Kingsberry Ln
- 2 Little St