

23 E Concord St Unit 1 Boston, MA 02118
South End Neighborhood
2
Beds
2.5
Baths
1,493
Sq Ft
1,437
Sq Ft Lot
Highlights
- Property is near public transit
- Patio
- Central Heating and Cooling System
- Rowhouse Architecture
- Shops
- 5-minute walk to Blackstone Square
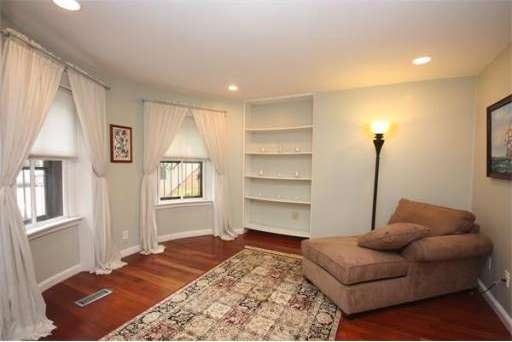
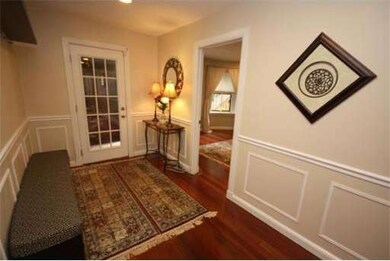
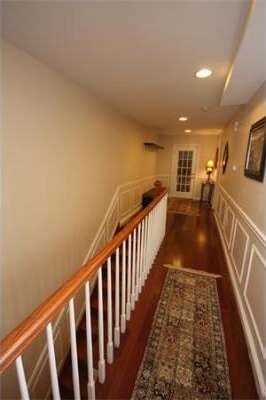
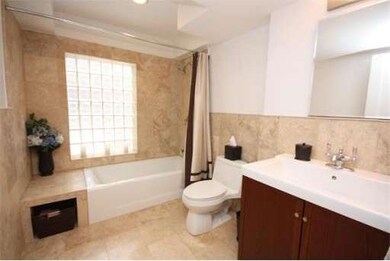
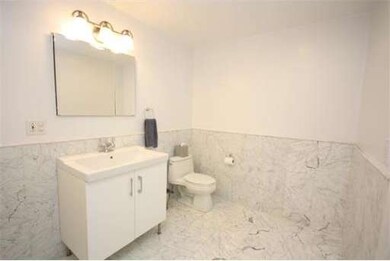
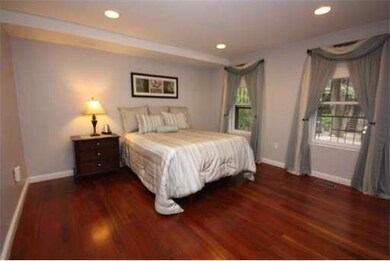
About This Home
As of June 2023Huge 2 bed 2.5 bath garden duplex w/deeded parking! Private patio perfect for grilling and entertaining. New kitchen and baths! Gorgeous chef's kitchen w/ss appliances and granite counters. Gleaming hardwood floors. AC. W/D in unit. Master suite with walk in closet with adjustable storage systems, marble bathroom and shower with dual function rain showerhead. Second bath w/ tub, marble. Open layout in living dining kitchen area with breakfast island. Steps to Blackstone Pk,
Last Agent to Sell the Property
Robert Bettencourt
Berkshire Hathaway HomeServices Warren Residential Listed on: 05/15/2012
Last Buyer's Agent
Robert Bettencourt
Berkshire Hathaway HomeServices Warren Residential Listed on: 05/15/2012
Property Details
Home Type
- Condominium
Est. Annual Taxes
- $8,811
Year Built
- Built in 1900
Home Design
- Rowhouse Architecture
Interior Spaces
- 1,493 Sq Ft Home
- 2-Story Property
Kitchen
- Oven
- Range
- Microwave
- Freezer
- Dishwasher
- Disposal
Bedrooms and Bathrooms
- 2 Bedrooms
Laundry
- Laundry in unit
- Dryer
- Washer
Parking
- 1 Car Parking Space
- Off-Street Parking
- Deeded Parking
Location
- Property is near public transit
- Property is near schools
Utilities
- Central Heating and Cooling System
- Gas Water Heater
Additional Features
- Patio
- Near Conservation Area
Listing and Financial Details
- Assessor Parcel Number 4706052
Community Details
Overview
- Property has a Home Owners Association
- Association fees include water, sewer, insurance, ground maintenance, snow removal
- 3 Units
Amenities
- Shops
Pet Policy
- Pets Allowed
Ownership History
Date
Name
Owned For
Owner Type
Purchase Details
Listed on
Mar 8, 2023
Closed on
Jun 17, 2023
Sold by
Siegel Noah and Siegel Alison
Bought by
Matravers Lt and Matravers
Seller's Agent
Jeff Hamilton
Columbus and Over Group, LLC
Buyer's Agent
Jeff Hamilton
Columbus and Over Group, LLC
List Price
$1,199,000
Sold Price
$1,107,000
Premium/Discount to List
-$92,000
-7.67%
Views
56
Current Estimated Value
Home Financials for this Owner
Home Financials are based on the most recent Mortgage that was taken out on this home.
Estimated Appreciation
$123,219
Avg. Annual Appreciation
4.06%
Purchase Details
Listed on
Mar 13, 2013
Closed on
Jul 12, 2013
Sold by
Shuman Gary M and Shuman Beth
Bought by
Miller R A R and Miller Lauren J
Seller's Agent
Robert Cohen
Engel & Volkers Boston
Buyer's Agent
Resco Homes
Gibson Sotheby's International Realty
List Price
$774,000
Sold Price
$790,000
Premium/Discount to List
$16,000
2.07%
Home Financials for this Owner
Home Financials are based on the most recent Mortgage that was taken out on this home.
Avg. Annual Appreciation
3.44%
Original Mortgage
$632,000
Interest Rate
3%
Mortgage Type
Purchase Money Mortgage
Purchase Details
Closed on
Apr 11, 2008
Sold by
Countrywide Home Loans
Bought by
Valerio Bret
Home Financials for this Owner
Home Financials are based on the most recent Mortgage that was taken out on this home.
Original Mortgage
$367,000
Interest Rate
6.3%
Mortgage Type
Purchase Money Mortgage
Purchase Details
Closed on
Dec 5, 2007
Sold by
Olson Kenneth and Olson Mers
Bought by
Countrywide Home Loans and Mers
Purchase Details
Closed on
May 26, 2006
Sold by
23 E Concord Llc and 23 E Concord St Condo
Bought by
Olson Kenneth
Home Financials for this Owner
Home Financials are based on the most recent Mortgage that was taken out on this home.
Original Mortgage
$147,000
Interest Rate
6.55%
Similar Homes in the area
Create a Home Valuation Report for This Property
The Home Valuation Report is an in-depth analysis detailing your home's value as well as a comparison with similar homes in the area
Home Values in the Area
Average Home Value in this Area
Purchase History
| Date | Type | Sale Price | Title Company |
|---|---|---|---|
| Condominium Deed | $1,107,000 | None Available | |
| Deed | $790,000 | -- | |
| Deed | $790,000 | -- | |
| Deed | $541,000 | -- | |
| Foreclosure Deed | $560,800 | -- | |
| Deed | -- | -- |
Source: Public Records
Mortgage History
| Date | Status | Loan Amount | Loan Type |
|---|---|---|---|
| Previous Owner | $731,250 | Purchase Money Mortgage | |
| Previous Owner | $632,000 | Purchase Money Mortgage | |
| Previous Owner | $417,000 | New Conventional | |
| Previous Owner | $365,000 | No Value Available | |
| Previous Owner | $367,000 | Purchase Money Mortgage | |
| Previous Owner | $147,000 | No Value Available | |
| Previous Owner | $514,500 | Purchase Money Mortgage | |
| Previous Owner | $450,000 | No Value Available |
Source: Public Records
Property History
| Date | Event | Price | Change | Sq Ft Price |
|---|---|---|---|---|
| 06/28/2023 06/28/23 | Sold | $1,107,000 | -1.6% | $743 / Sq Ft |
| 06/01/2023 06/01/23 | Pending | -- | -- | -- |
| 05/31/2023 05/31/23 | Price Changed | $1,125,000 | -2.1% | $755 / Sq Ft |
| 04/27/2023 04/27/23 | Price Changed | $1,149,000 | -4.2% | $771 / Sq Ft |
| 03/08/2023 03/08/23 | For Sale | $1,199,000 | 0.0% | $805 / Sq Ft |
| 11/14/2019 11/14/19 | Rented | $3,850 | 0.0% | -- |
| 10/16/2019 10/16/19 | For Rent | $3,850 | +10.0% | -- |
| 06/18/2019 06/18/19 | Rented | $3,500 | +16.7% | -- |
| 06/12/2019 06/12/19 | Under Contract | -- | -- | -- |
| 05/29/2019 05/29/19 | Price Changed | $3,000 | 0.0% | $4 / Sq Ft |
| 05/29/2019 05/29/19 | For Rent | $3,000 | -6.3% | -- |
| 05/29/2019 05/29/19 | Off Market | $3,200 | -- | -- |
| 04/22/2019 04/22/19 | Price Changed | $3,200 | -8.6% | $4 / Sq Ft |
| 04/17/2019 04/17/19 | For Rent | $3,500 | -9.1% | -- |
| 08/15/2018 08/15/18 | Rented | $3,850 | 0.0% | -- |
| 08/04/2018 08/04/18 | Under Contract | -- | -- | -- |
| 07/09/2018 07/09/18 | Price Changed | $3,850 | +28.3% | $3 / Sq Ft |
| 07/09/2018 07/09/18 | Rented | $3,000 | 0.0% | -- |
| 07/05/2018 07/05/18 | Under Contract | -- | -- | -- |
| 06/24/2018 06/24/18 | For Rent | $3,000 | -27.7% | -- |
| 06/20/2018 06/20/18 | Price Changed | $4,150 | -2.4% | $3 / Sq Ft |
| 05/29/2018 05/29/18 | For Rent | $4,250 | 0.0% | -- |
| 02/12/2018 02/12/18 | Rented | $4,250 | 0.0% | -- |
| 02/02/2018 02/02/18 | Under Contract | -- | -- | -- |
| 01/16/2018 01/16/18 | For Rent | $4,250 | 0.0% | -- |
| 08/23/2017 08/23/17 | Sold | $975,000 | 0.0% | $654 / Sq Ft |
| 07/17/2017 07/17/17 | Pending | -- | -- | -- |
| 07/10/2017 07/10/17 | Price Changed | $975,000 | -2.0% | $654 / Sq Ft |
| 06/01/2017 06/01/17 | Price Changed | $995,000 | -6.0% | $668 / Sq Ft |
| 05/09/2017 05/09/17 | For Sale | $1,059,000 | +34.1% | $711 / Sq Ft |
| 07/12/2013 07/12/13 | Sold | $790,000 | +2.1% | $530 / Sq Ft |
| 05/20/2013 05/20/13 | Pending | -- | -- | -- |
| 03/13/2013 03/13/13 | For Sale | $774,000 | +14.7% | $519 / Sq Ft |
| 08/30/2012 08/30/12 | Sold | $675,000 | -2.0% | $452 / Sq Ft |
| 08/30/2012 08/30/12 | Pending | -- | -- | -- |
| 06/26/2012 06/26/12 | Price Changed | $689,000 | -1.4% | $461 / Sq Ft |
| 05/15/2012 05/15/12 | For Sale | $699,000 | -- | $468 / Sq Ft |
Source: MLS Property Information Network (MLS PIN)
Tax History Compared to Growth
Tax History
| Year | Tax Paid | Tax Assessment Tax Assessment Total Assessment is a certain percentage of the fair market value that is determined by local assessors to be the total taxable value of land and additions on the property. | Land | Improvement |
|---|---|---|---|---|
| 2025 | $12,321 | $1,064,000 | $0 | $1,064,000 |
| 2024 | $14,028 | $1,287,000 | $0 | $1,287,000 |
| 2023 | $13,546 | $1,261,300 | $0 | $1,261,300 |
| 2022 | $13,589 | $1,249,000 | $0 | $1,249,000 |
| 2021 | $13,066 | $1,224,600 | $0 | $1,224,600 |
| 2020 | $12,009 | $1,137,200 | $0 | $1,137,200 |
| 2019 | $11,633 | $1,103,700 | $0 | $1,103,700 |
| 2018 | $10,908 | $1,040,800 | $0 | $1,040,800 |
| 2017 | $10,498 | $991,300 | $0 | $991,300 |
| 2016 | $10,485 | $953,200 | $0 | $953,200 |
| 2015 | $10,142 | $837,500 | $0 | $837,500 |
| 2014 | $9,562 | $760,100 | $0 | $760,100 |
Source: Public Records
Agents Affiliated with this Home
-
Seller's Agent in 2023
Jeff Hamilton
Columbus and Over Group, LLC
(617) 645-3407
31 in this area
78 Total Sales
-
A
Seller Co-Listing Agent in 2023
Abigail Ojemann
Compass
(617) 645-3407
3 in this area
4 Total Sales
-
Seller's Agent in 2019
Jamie Gaines
Compass
(617) 595-6961
24 in this area
74 Total Sales
-
R
Seller's Agent in 2019
Rachel Delfino
Compass
(617) 733-1515
-
Buyer's Agent in 2019
Anthony Enslow
Coldwell Banker Realty - Boston
(617) 233-2783
1 in this area
17 Total Sales
-
Buyer's Agent in 2019
Melissa McColgan
Grove Property Group
(617) 596-1106
5 Total Sales
Map
Source: MLS Property Information Network (MLS PIN)
MLS Number: 71382859
APN: CBOS-000000-000008-001452-000008
Disclaimer: Certain information contained herein is derived from information provided by parties other than Homes.com. All information provided is deemed reliable, but is not guaranteed to be accurate and should be independently verified.
![]() The property listing data and information, or the Images, set forth herein were provided to MLS Property Information Network, Inc. from third party sources, including sellers, lessors and public records, and were compiled by MLS Property Information Network, Inc. The property listing data and information, and the Images, are for the personal, non-commercial use of consumers having a good faith interest in purchasing or leasing listed properties of the type displayed to them and may not be used for any purpose other than to identify prospective properties which such consumers may have a good faith interest in purchasing or leasing. MLS Property Information Network, Inc. and its subscribers disclaim any and all representations and warranties as to the accuracy of the property listing data and information, or as to the accuracy of any of the Images, set forth herein.
The property listing data and information, or the Images, set forth herein were provided to MLS Property Information Network, Inc. from third party sources, including sellers, lessors and public records, and were compiled by MLS Property Information Network, Inc. The property listing data and information, and the Images, are for the personal, non-commercial use of consumers having a good faith interest in purchasing or leasing listed properties of the type displayed to them and may not be used for any purpose other than to identify prospective properties which such consumers may have a good faith interest in purchasing or leasing. MLS Property Information Network, Inc. and its subscribers disclaim any and all representations and warranties as to the accuracy of the property listing data and information, or as to the accuracy of any of the Images, set forth herein.
Nearby Homes
- 1682 Washington St Unit 8
- 1666 Washington St Unit 3
- 1666 Washington St Unit 2
- 7 E Springfield St Unit 5B
- 7 E Springfield St Unit PH6
- 19 Worcester Square Unit 1
- 32 E Springfield St Unit 3
- 1723 Washington St Unit 309
- 2 E Concord St Unit 1
- 1750 Washington St Unit 2
- 666 Massachusetts Ave
- 94 W Springfield St Unit 1
- 1597 Washington St Unit 600
- 486 Shawmut Ave Unit 1
- 50 E Springfield St Unit 1
- 2 Cumston St
- 1 Worcester Square Unit 4
- 520 Shawmut Ave Unit 1
- 54 E Springfield St Unit 1
- 771 Harrison Ave Unit 208