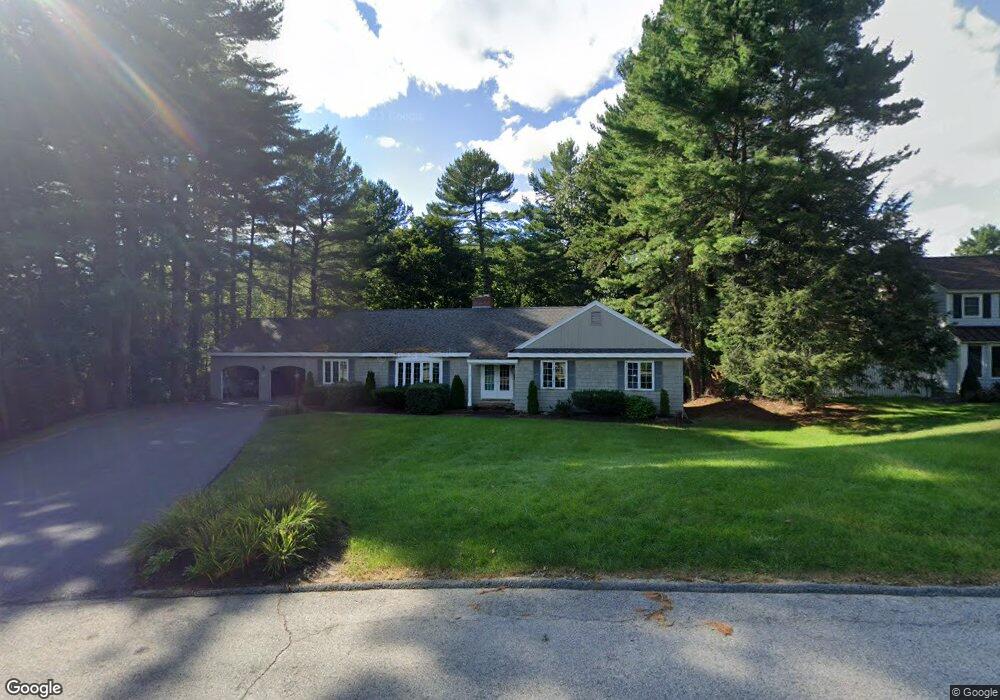
23 Enfield Dr Andover, MA 01810
Estimated Value: $1,055,687 - $1,460,000
3
Beds
4
Baths
3,123
Sq Ft
$417/Sq Ft
Est. Value
About This Home
This home is located at 23 Enfield Dr, Andover, MA 01810 and is currently estimated at $1,302,922, approximately $417 per square foot. 23 Enfield Dr is a home located in Essex County with nearby schools including South Elementary School, Doherty Middle School, and Andover High School.
Ownership History
Date
Name
Owned For
Owner Type
Purchase Details
Closed on
Oct 21, 2021
Sold by
Prudden Peter and Prudden Debra M
Bought by
Prudden Ft
Current Estimated Value
Purchase Details
Closed on
Jan 28, 1994
Sold by
Boshar Mark F
Bought by
Prudden Peter J
Home Financials for this Owner
Home Financials are based on the most recent Mortgage that was taken out on this home.
Original Mortgage
$238,500
Interest Rate
7.11%
Mortgage Type
Purchase Money Mortgage
Create a Home Valuation Report for This Property
The Home Valuation Report is an in-depth analysis detailing your home's value as well as a comparison with similar homes in the area
Home Values in the Area
Average Home Value in this Area
Purchase History
| Date | Buyer | Sale Price | Title Company |
|---|---|---|---|
| Prudden Ft | -- | None Available | |
| Prudden Peter J | $265,000 | -- |
Source: Public Records
Mortgage History
| Date | Status | Borrower | Loan Amount |
|---|---|---|---|
| Previous Owner | Prudden Peter J | $238,500 | |
| Previous Owner | Prudden Peter J | $170,000 | |
| Previous Owner | Prudden Peter J | $170,200 |
Source: Public Records
Tax History Compared to Growth
Tax History
| Year | Tax Paid | Tax Assessment Tax Assessment Total Assessment is a certain percentage of the fair market value that is determined by local assessors to be the total taxable value of land and additions on the property. | Land | Improvement |
|---|---|---|---|---|
| 2024 | $11,531 | $895,300 | $560,600 | $334,700 |
| 2023 | $11,071 | $810,500 | $504,900 | $305,600 |
| 2022 | $10,308 | $706,000 | $439,400 | $266,600 |
| 2021 | $9,887 | $646,600 | $399,200 | $247,400 |
| 2020 | $9,516 | $634,000 | $389,600 | $244,400 |
| 2019 | $9,104 | $596,200 | $356,000 | $240,200 |
| 2018 | $8,852 | $566,000 | $342,300 | $223,700 |
| 2017 | $8,492 | $559,400 | $335,700 | $223,700 |
| 2016 | $8,320 | $561,400 | $335,700 | $225,700 |
| 2015 | $8,049 | $537,700 | $322,800 | $214,900 |
Source: Public Records
Map
Nearby Homes