
Landlord's Agent in 2023
Lauren Brooks
Hillman Homes
(617) 527-1907
25 Total Sales


Estimated Value: $891,208 - $964,000
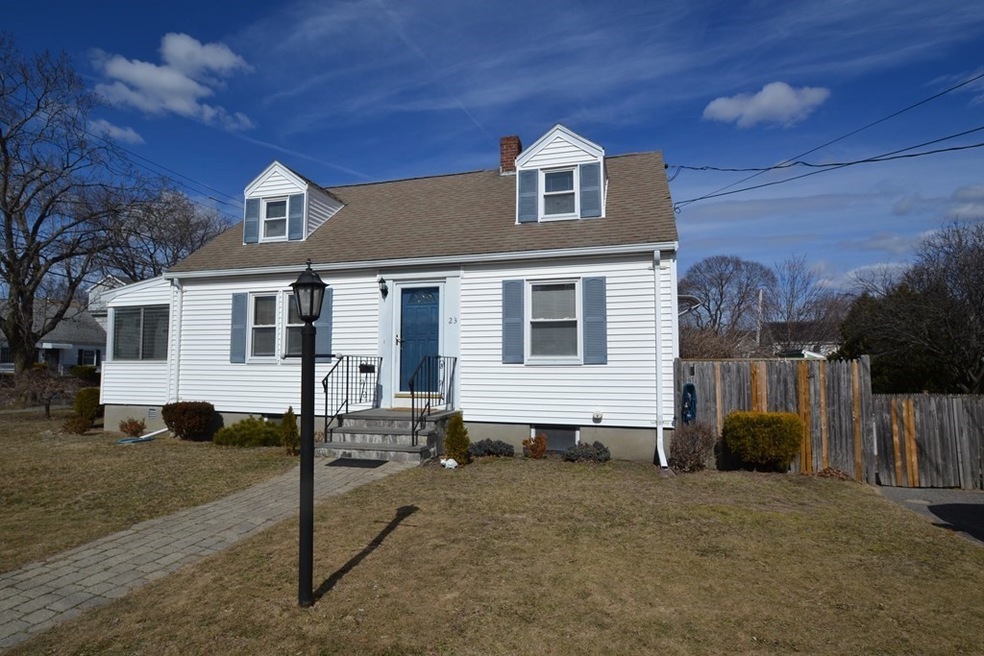
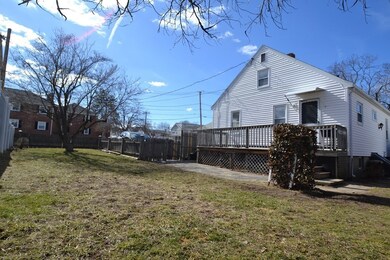
Amazing opportunity to live in Arlington! Entire House: Bright & sunny single family cape style house in East Arlington. This 3 bedroom (plus) checks all of the boxes…large eat in kitchen, separate dining room, sizeable living room and a screened in sun porch! The deck and yard complete the package. Full finished basement with washer and dryer and extra full bathroom. The fabulous location is close to the amenities on bustling Broadway and Mass Ave, and has many commuter options with nearby bus routes to Boston. Close by is the Mystic River pathway and the Minuteman bike trail countless restaurants, shopping and coffee shops. Move right in and enjoy it all! No smoking plus good credit and references a must. Tenant to pay for credit score and background check. Pets will be considered on a case by case situation.
| Date | Buyer | Sale Price | Title Company |
|---|---|---|---|
| Obrien Tr Colleen F | -- | -- |
| Date | Event | Price | List to Sale | Price per Sq Ft |
|---|---|---|---|---|
| 03/31/2023 03/31/23 | Rented | $3,300 | 0.0% | -- |
| 03/17/2023 03/17/23 | Under Contract | -- | -- | -- |
| 03/11/2023 03/11/23 | For Rent | $3,300 | -- | -- |
| Year | Tax Paid | Tax Assessment Tax Assessment Total Assessment is a certain percentage of the fair market value that is determined by local assessors to be the total taxable value of land and additions on the property. | Land | Improvement |
|---|---|---|---|---|
| 2025 | $8,232 | $764,300 | $480,800 | $283,500 |
| 2024 | $7,573 | $715,100 | $456,800 | $258,300 |
| 2023 | $7,037 | $627,700 | $408,700 | $219,000 |
| 2022 | $6,779 | $593,600 | $384,700 | $208,900 |
| 2021 | $6,649 | $586,300 | $384,700 | $201,600 |
| 2020 | $6,484 | $586,300 | $384,700 | $201,600 |
| 2019 | $6,084 | $540,300 | $348,600 | $191,700 |
| 2018 | $6,335 | $522,300 | $330,600 | $191,700 |
| 2017 | $6,031 | $480,200 | $288,500 | $191,700 |
| 2016 | $5,608 | $438,100 | $246,400 | $191,700 |
| 2015 | $5,524 | $407,700 | $228,400 | $179,300 |
Landlord's Agent in 2023
Lauren Brooks
Hillman Homes
(617) 527-1907
25 Total Sales
Tenant's Agent in 2023
Neely Sullivan
Coldwell Banker Realty - Concord
(617) 276-4128
Source: MLS Property Information Network (MLS PIN)
MLS Number: 73086660
APN: ARLI-000038-000004-000001A
Disclaimer: Certain information contained herein is derived from information provided by parties other than Homes.com. All information provided is deemed reliable, but is not guaranteed to be accurate and should be independently verified.
![]() The property listing data and information, or the Images, set forth herein were provided to MLS Property Information Network, Inc. from third party sources, including sellers, lessors and public records, and were compiled by MLS Property Information Network, Inc. The property listing data and information, and the Images, are for the personal, non-commercial use of consumers having a good faith interest in purchasing or leasing listed properties of the type displayed to them and may not be used for any purpose other than to identify prospective properties which such consumers may have a good faith interest in purchasing or leasing. MLS Property Information Network, Inc. and its subscribers disclaim any and all representations and warranties as to the accuracy of the property listing data and information, or as to the accuracy of any of the Images, set forth herein.
The property listing data and information, or the Images, set forth herein were provided to MLS Property Information Network, Inc. from third party sources, including sellers, lessors and public records, and were compiled by MLS Property Information Network, Inc. The property listing data and information, and the Images, are for the personal, non-commercial use of consumers having a good faith interest in purchasing or leasing listed properties of the type displayed to them and may not be used for any purpose other than to identify prospective properties which such consumers may have a good faith interest in purchasing or leasing. MLS Property Information Network, Inc. and its subscribers disclaim any and all representations and warranties as to the accuracy of the property listing data and information, or as to the accuracy of any of the Images, set forth herein.