A
Seller's Agent in 2024
ANTOINETTE DEPIANO
KELLER WILLIAMS METROPOLITAN
Estimated Value: $436,000 - $494,000
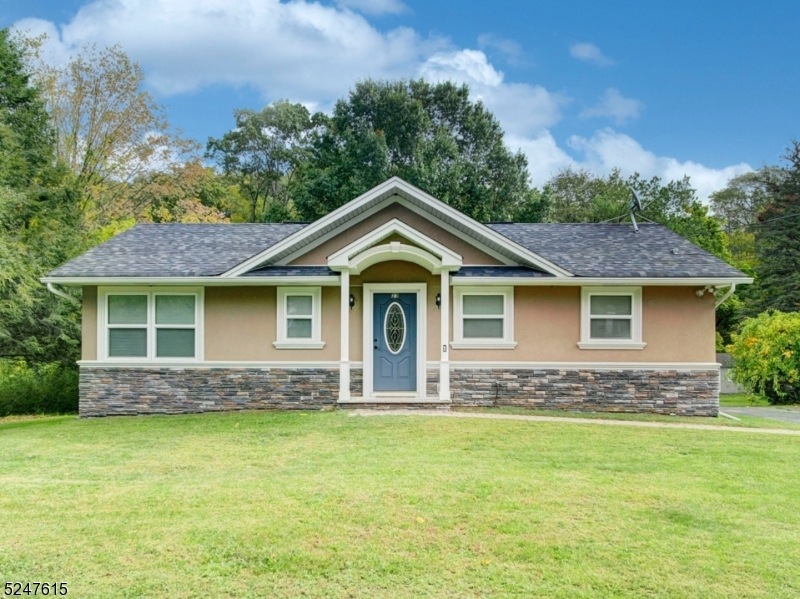
This home is located at 23 Flanders Netcong Rd, Flanders, NJ 07836 since 15 May 2024 and is currently estimated at $462,020, approximately $423 per square foot. This property was built in 1967. 23 Flanders Netcong Rd is a home located in Morris County with nearby schools including Mt Olive Middle School and Mount Olive High School.
Last Agent to Sell the Property
ANTOINETTE DEPIANO
KELLER WILLIAMS METROPOLITAN Brokerage Phone: 973-539-1120 Listed on: 05/15/2024
| Date | Buyer | Sale Price | Title Company |
|---|---|---|---|
| Malloy Brian | $451,000 | Westcor Land Title Insurance C | |
| Malloy Brian | $451,000 | Westcor Land Title Insurance C | |
| Gonzalez John | $257,000 | All Ahead Title Agency Llc | |
| Lidwin Bernadeta | $105,000 | -- | |
| Federal National Mortgage Association | -- | Attorney |
| Date | Status | Borrower | Loan Amount |
|---|---|---|---|
| Open | Malloy Brian | $301,000 | |
| Closed | Malloy Brian | $301,000 | |
| Previous Owner | Gonzalez John | $249,200 | |
| Previous Owner | Lidwin Bernadeta | -- |
| Date | Event | Price | List to Sale | Price per Sq Ft | Prior Sale |
|---|---|---|---|---|---|
| 07/25/2024 07/25/24 | Sold | $451,000 | +12.8% | $413 / Sq Ft | |
| 05/28/2024 05/28/24 | Pending | -- | -- | -- | |
| 05/17/2024 05/17/24 | For Sale | $400,000 | +55.6% | $366 / Sq Ft | |
| 04/12/2017 04/12/17 | Sold | $257,000 | -3.0% | $235 / Sq Ft | View Prior Sale |
| 03/10/2017 03/10/17 | Pending | -- | -- | -- | |
| 10/25/2016 10/25/16 | For Sale | $265,000 | +152.4% | $243 / Sq Ft | |
| 07/29/2016 07/29/16 | Sold | $105,000 | -30.0% | $96 / Sq Ft | View Prior Sale |
| 06/27/2016 06/27/16 | Pending | -- | -- | -- | |
| 09/23/2015 09/23/15 | For Sale | $150,000 | -- | $137 / Sq Ft |
| Year | Tax Paid | Tax Assessment Tax Assessment Total Assessment is a certain percentage of the fair market value that is determined by local assessors to be the total taxable value of land and additions on the property. | Land | Improvement |
|---|---|---|---|---|
| 2025 | $7,991 | $229,300 | $139,700 | $89,600 |
| 2024 | $7,537 | $229,300 | $139,700 | $89,600 |
| 2023 | $7,537 | $229,300 | $139,700 | $89,600 |
| 2022 | $7,700 | $229,300 | $139,700 | $89,600 |
| 2021 | $7,700 | $229,300 | $139,700 | $89,600 |
| 2020 | $7,597 | $229,300 | $139,700 | $89,600 |
| 2019 | $7,571 | $229,300 | $139,700 | $89,600 |
| 2018 | $7,498 | $229,300 | $139,700 | $89,600 |
| 2017 | $7,367 | $229,300 | $139,700 | $89,600 |
| 2016 | $7,134 | $229,300 | $139,700 | $89,600 |
| 2015 | $7,301 | $229,300 | $139,700 | $89,600 |
| 2014 | $7,308 | $229,300 | $139,700 | $89,600 |
A
Seller's Agent in 2024
ANTOINETTE DEPIANO
KELLER WILLIAMS METROPOLITAN

Buyer's Agent in 2024
Nicole Haslett
KELLER WILLIAMS METROPOLITAN
(908) 887-0862
8 in this area
143 Total Sales
Seller's Agent in 2017
Sharon Caruso
RE/MAX
(973) 945-8142
144 in this area
216 Total Sales
R
Seller's Agent in 2016
RAMON VALLE
REALTY EXECUTIVES EXCEPTIONAL
Buyer's Agent in 2016
Deborah Piekarz
COLDWELL BANKER REALTY
(973) 713-2696
14 in this area
44 Total Sales
Source: Garden State MLS
MLS Number: 3901963
APN: 27-04300-0000-00014
Disclaimer: Certain information contained herein is derived from information provided by parties other than Homes.com. All information provided is deemed reliable, but is not guaranteed to be accurate and should be independently verified.
![]() The data relating to real estate for sale on this website comes in part from the IDX Program of Garden State Multiple Listing Service, L.L.C. Real estate listings held by other brokerage firms are marked as IDX Listing.
The data relating to real estate for sale on this website comes in part from the IDX Program of Garden State Multiple Listing Service, L.L.C. Real estate listings held by other brokerage firms are marked as IDX Listing.
Information deemed reliable but not guaranteed.
Copyright © 2025 Garden State Multiple Listing Service, L.L.C. All rights reserved.
Notice: The dissemination of listings on this website does not constitute the consent required by N.J.A.C. 11:5.6.1 (n) for the advertisement of listings exclusively for sale by another broker. Any such consent must be obtained in writing from the listing broker.
This information is being provided for Consumers’ personal, non-commercial use and may not be used for any purpose other than to identify prospective properties Consumers may be interested in purchasing.