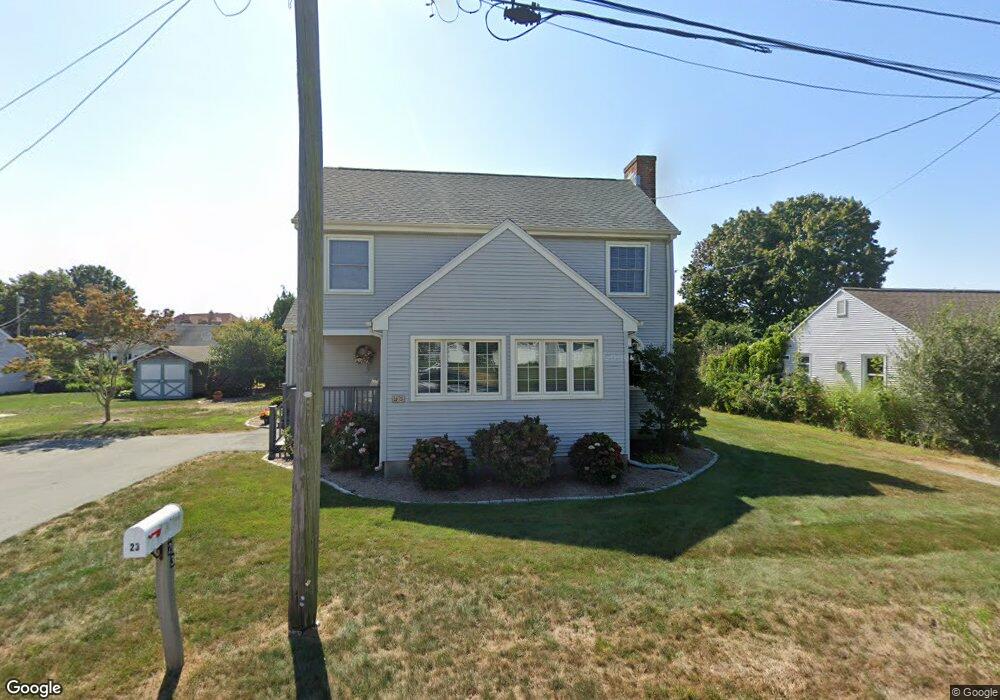
23 Gates Rd Old Saybrook, CT 06475
Estimated Value: $1,082,423 - $1,499,000
3
Beds
3
Baths
2,062
Sq Ft
$603/Sq Ft
Est. Value
About This Home
This home is located at 23 Gates Rd, Old Saybrook, CT 06475 and is currently estimated at $1,243,106, approximately $602 per square foot. 23 Gates Rd is a home located in Middlesex County with nearby schools including Kathleen E. Goodwin School, Old Saybrook Middle School, and Old Saybrook Senior High School.
Ownership History
Date
Name
Owned For
Owner Type
Purchase Details
Closed on
Nov 14, 2025
Sold by
Broadhurst Joan C
Bought by
Sikorski David M
Current Estimated Value
Purchase Details
Closed on
Mar 13, 2006
Sold by
Henegan Barbara
Bought by
Broadhurst Philip and Broadhurst Joan
Home Financials for this Owner
Home Financials are based on the most recent Mortgage that was taken out on this home.
Original Mortgage
$715,000
Interest Rate
7.16%
Mortgage Type
Purchase Money Mortgage
Create a Home Valuation Report for This Property
The Home Valuation Report is an in-depth analysis detailing your home's value as well as a comparison with similar homes in the area
Home Values in the Area
Average Home Value in this Area
Purchase History
| Date | Buyer | Sale Price | Title Company |
|---|---|---|---|
| Sikorski David M | -- | -- | |
| Broadhurst Philip | $715,000 | -- |
Source: Public Records
Mortgage History
| Date | Status | Borrower | Loan Amount |
|---|---|---|---|
| Previous Owner | Broadhurst Philip | $255,000 | |
| Previous Owner | Broadhurst Philip | $335,500 | |
| Previous Owner | Broadhurst Philip | $350,000 | |
| Previous Owner | Broadhurst Philip | $715,000 |
Source: Public Records
Tax History
| Year | Tax Paid | Tax Assessment Tax Assessment Total Assessment is a certain percentage of the fair market value that is determined by local assessors to be the total taxable value of land and additions on the property. | Land | Improvement |
|---|---|---|---|---|
| 2025 | $9,418 | $607,600 | $305,200 | $302,400 |
| 2024 | $9,236 | $607,600 | $305,200 | $302,400 |
| 2023 | $7,673 | $375,200 | $168,100 | $207,100 |
| 2022 | $7,534 | $375,200 | $168,100 | $207,100 |
| 2021 | $7,523 | $375,200 | $168,100 | $207,100 |
| 2020 | $7,523 | $375,200 | $168,100 | $207,100 |
| 2019 | $7,410 | $375,200 | $168,100 | $207,100 |
| 2018 | $8,085 | $412,500 | $174,800 | $237,700 |
| 2017 | $8,110 | $412,500 | $174,800 | $237,700 |
| 2016 | $7,904 | $410,400 | $174,800 | $235,600 |
| 2015 | $7,720 | $410,400 | $174,800 | $235,600 |
| 2014 | $7,592 | $410,400 | $174,800 | $235,600 |
Source: Public Records
Map
Nearby Homes
- 24 W Shore Dr
- 10 Edwards Rd
- 372 Maple Ave
- 1 Beamon Meadow Place
- 73 Knollwood Dr
- 104 Knollwood Dr
- 105 Fenwood Dr
- 33 Fenwood Rd
- 11 S View Terrace
- 23 Clinton Ave
- 41 Farview Ave
- 39 Middletown Ave
- 2 Pequot Trail
- 367 Main St Unit 7
- 25 Sunset Rd Unit 7
- 18 Quarry St
- 2 Old South Cove Rd
- 60 Ingham Hill Rd
- 13 College St
- 17 College St
Your Personal Tour Guide
Ask me questions while you tour the home.