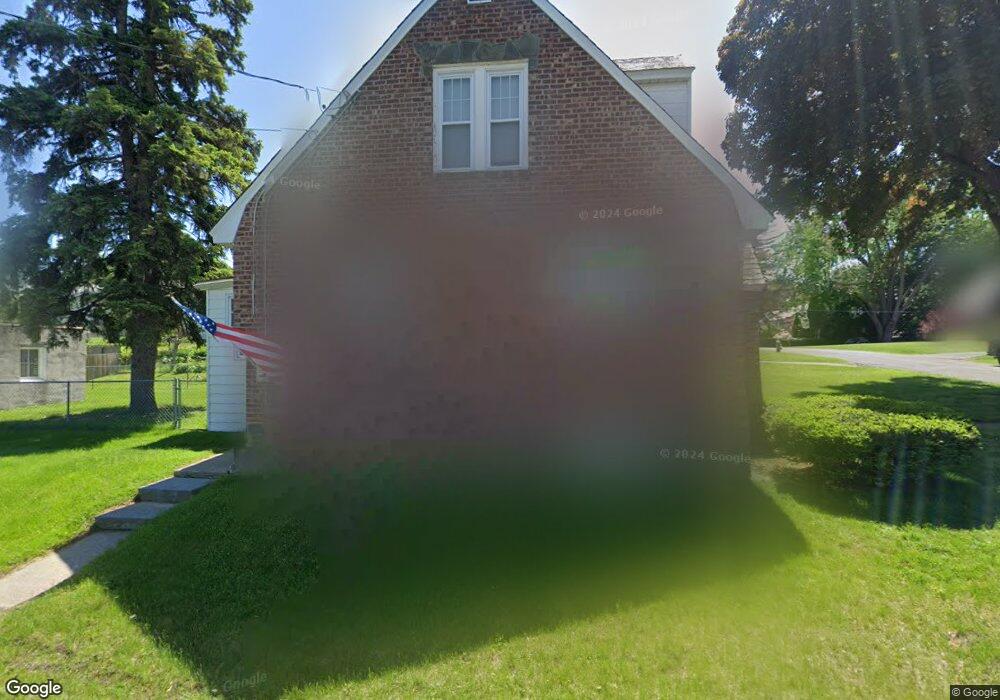
23 Glynn St Albany, NY 12203
Campus Area NeighborhoodEstimated Value: $267,000 - $300,815
3
Beds
2
Baths
1,236
Sq Ft
$229/Sq Ft
Est. Value
About This Home
This home is located at 23 Glynn St, Albany, NY 12203 and is currently estimated at $282,454, approximately $228 per square foot. 23 Glynn St is a home located in Albany County with nearby schools including Eagle Point Elementary School, William S Hackett Middle School, and Albany High School.
Ownership History
Date
Name
Owned For
Owner Type
Purchase Details
Closed on
Aug 8, 2023
Sold by
Panetta Patricia A
Bought by
Moran Scott
Current Estimated Value
Home Financials for this Owner
Home Financials are based on the most recent Mortgage that was taken out on this home.
Original Mortgage
$234,650
Outstanding Balance
$227,863
Interest Rate
5.5%
Mortgage Type
New Conventional
Estimated Equity
$54,591
Create a Home Valuation Report for This Property
The Home Valuation Report is an in-depth analysis detailing your home's value as well as a comparison with similar homes in the area
Home Values in the Area
Average Home Value in this Area
Purchase History
| Date | Buyer | Sale Price | Title Company |
|---|---|---|---|
| Moran Scott | $247,000 | None Listed On Document |
Source: Public Records
Mortgage History
| Date | Status | Borrower | Loan Amount |
|---|---|---|---|
| Open | Moran Scott | $234,650 |
Source: Public Records
Tax History Compared to Growth
Tax History
| Year | Tax Paid | Tax Assessment Tax Assessment Total Assessment is a certain percentage of the fair market value that is determined by local assessors to be the total taxable value of land and additions on the property. | Land | Improvement |
|---|---|---|---|---|
| 2024 | $6,062 | $234,000 | $46,800 | $187,200 |
| 2023 | $6,712 | $168,000 | $34,000 | $134,000 |
| 2022 | $1,868 | $168,000 | $34,000 | $134,000 |
| 2021 | $1,860 | $168,000 | $34,000 | $134,000 |
| 2020 | $3,029 | $168,000 | $34,000 | $134,000 |
| 2019 | $6,614 | $168,000 | $34,000 | $134,000 |
| 2018 | $1,825 | $168,000 | $34,000 | $134,000 |
| 2017 | $2,439 | $168,000 | $34,000 | $134,000 |
| 2016 | $4,880 | $168,000 | $34,000 | $134,000 |
| 2015 | $3,900 | $176,800 | $35,400 | $141,400 |
| 2014 | -- | $176,800 | $35,400 | $141,400 |
Source: Public Records
Map
Nearby Homes