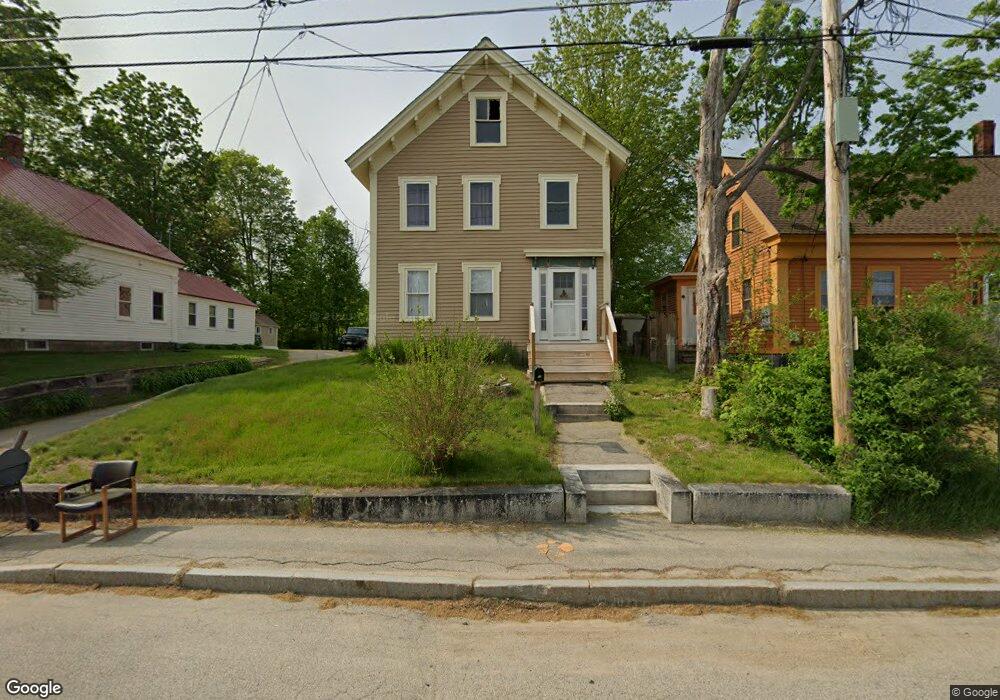
23 Grove St Farmington, NH 03835
Estimated Value: $363,695 - $400,000
3
Beds
2
Baths
2,233
Sq Ft
$172/Sq Ft
Est. Value
About This Home
This home is located at 23 Grove St, Farmington, NH 03835 and is currently estimated at $383,424, approximately $171 per square foot. 23 Grove St is a home located in Strafford County with nearby schools including Valley View Community School, Henry Wilson Memorial School, and Farmington Senior High School.
Ownership History
Date
Name
Owned For
Owner Type
Purchase Details
Closed on
Mar 12, 2009
Sold by
Fnma
Bought by
Villemont Carl S
Current Estimated Value
Home Financials for this Owner
Home Financials are based on the most recent Mortgage that was taken out on this home.
Original Mortgage
$98,420
Outstanding Balance
$62,747
Interest Rate
5.18%
Mortgage Type
Purchase Money Mortgage
Estimated Equity
$320,677
Purchase Details
Closed on
Feb 11, 2008
Sold by
Parent Jason A and Wells Fargo Bank
Bought by
Federal National Mortgage Association
Purchase Details
Closed on
Mar 15, 2000
Sold by
Lepage Richard F and Lepage Penelope A
Bought by
Vaughn Ruth Ellen
Home Financials for this Owner
Home Financials are based on the most recent Mortgage that was taken out on this home.
Original Mortgage
$118,900
Interest Rate
8.24%
Mortgage Type
Purchase Money Mortgage
Create a Home Valuation Report for This Property
The Home Valuation Report is an in-depth analysis detailing your home's value as well as a comparison with similar homes in the area
Home Values in the Area
Average Home Value in this Area
Purchase History
| Date | Buyer | Sale Price | Title Company |
|---|---|---|---|
| Villemont Carl S | $40,000 | -- | |
| Federal National Mortgage Association | $127,700 | -- | |
| Vaughn Ruth Ellen | $118,900 | -- |
Source: Public Records
Mortgage History
| Date | Status | Borrower | Loan Amount |
|---|---|---|---|
| Open | Vaughn Ruth Ellen | $5,971 | |
| Open | Vaughn Ruth Ellen | $98,420 | |
| Previous Owner | Vaughn Ruth Ellen | $118,900 |
Source: Public Records
Tax History Compared to Growth
Tax History
| Year | Tax Paid | Tax Assessment Tax Assessment Total Assessment is a certain percentage of the fair market value that is determined by local assessors to be the total taxable value of land and additions on the property. | Land | Improvement |
|---|---|---|---|---|
| 2024 | $4,727 | $317,700 | $100,200 | $217,500 |
| 2023 | $4,875 | $190,000 | $39,900 | $150,100 |
| 2022 | $4,594 | $190,000 | $39,900 | $150,100 |
| 2021 | $4,440 | $190,000 | $39,900 | $150,100 |
| 2020 | $4,355 | $190,000 | $39,900 | $150,100 |
| 2019 | $4,226 | $190,000 | $39,900 | $150,100 |
| 2018 | $3,842 | $146,300 | $34,000 | $112,300 |
| 2017 | $4,069 | $146,300 | $34,000 | $112,300 |
| 2016 | $3,662 | $146,300 | $34,000 | $112,300 |
| 2015 | $3,671 | $146,300 | $34,000 | $112,300 |
| 2014 | $3,564 | $146,300 | $34,000 | $112,300 |
| 2013 | $3,467 | $165,080 | $49,600 | $115,480 |
Source: Public Records
Map
Nearby Homes