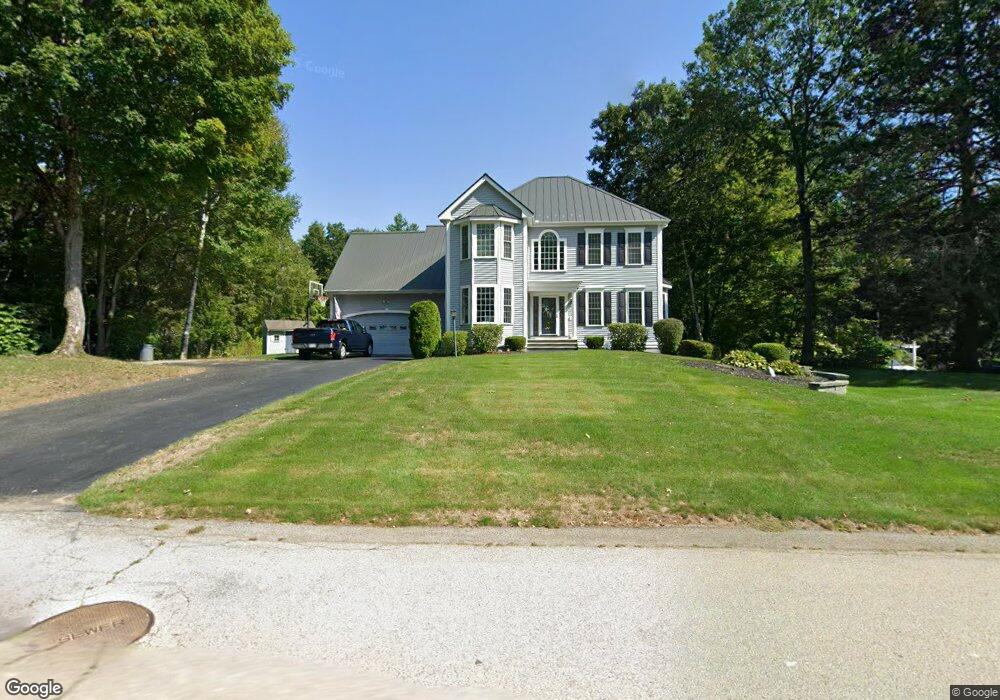
23 Hadley Rd Pepperell, MA 01463
Estimated Value: $835,844 - $1,120,000
Studio
3
Baths
3,645
Sq Ft
$256/Sq Ft
Est. Value
About This Home
This home is located at 23 Hadley Rd, Pepperell, MA 01463 and is currently estimated at $934,461, approximately $256 per square foot. 23 Hadley Rd is a home located in Middlesex County with nearby schools including North Middlesex Regional High School, Pepperell Christian Academy, and Maple Dene & Moppet School.
Ownership History
Date
Name
Owned For
Owner Type
Purchase Details
Closed on
Jul 3, 2001
Sold by
Homestead Real Prop
Bought by
Anderson Scott W
Current Estimated Value
Home Financials for this Owner
Home Financials are based on the most recent Mortgage that was taken out on this home.
Original Mortgage
$275,000
Interest Rate
7.14%
Mortgage Type
Purchase Money Mortgage
Create a Home Valuation Report for This Property
The Home Valuation Report is an in-depth analysis detailing your home's value as well as a comparison with similar homes in the area
Home Values in the Area
Average Home Value in this Area
Purchase History
| Date | Buyer | Sale Price | Title Company |
|---|---|---|---|
| Anderson Scott W | $421,000 | -- |
Source: Public Records
Mortgage History
| Date | Status | Borrower | Loan Amount |
|---|---|---|---|
| Open | Anderson Scott W | $50,000 | |
| Open | Anderson Scott W | $337,000 | |
| Closed | Anderson Scott W | $275,000 | |
| Closed | Anderson Scott W | $75,000 |
Source: Public Records
Tax History
| Year | Tax Paid | Tax Assessment Tax Assessment Total Assessment is a certain percentage of the fair market value that is determined by local assessors to be the total taxable value of land and additions on the property. | Land | Improvement |
|---|---|---|---|---|
| 2025 | $10,544 | $720,700 | $232,800 | $487,900 |
| 2024 | $9,597 | $668,800 | $212,700 | $456,100 |
| 2023 | $9,399 | $620,800 | $192,700 | $428,100 |
| 2022 | $9,071 | $528,900 | $152,600 | $376,300 |
| 2021 | $8,698 | $485,400 | $128,600 | $356,800 |
| 2020 | $10,928 | $491,400 | $128,600 | $362,800 |
| 2019 | $7,507 | $452,500 | $128,600 | $323,900 |
| 2018 | $7,125 | $434,700 | $128,600 | $306,100 |
| 2017 | $6,655 | $418,800 | $120,600 | $298,200 |
| 2016 | $6,480 | $392,000 | $120,600 | $271,400 |
| 2015 | $6,252 | $392,000 | $120,600 | $271,400 |
| 2014 | $6,185 | $390,000 | $124,600 | $265,400 |
Source: Public Records
Map
Nearby Homes
- 8 Casie Ln
- 27 Merrimac Dr
- 14 Brookline St
- 39 Hollis St Unit A
- 28-30 Groton St
- 38 Tarbell St Unit 5B
- 38 Tarbell St Unit 1D
- 29 Tarbell St
- 113-115 Main St
- 147 Nashua Rd
- 11 Unkety Brook Way
- 12 Unkety Brook Way
- 38 River Rd Unit 11
- 114 Groton St
- 13 Birch Dr
- 4 Southgate Rd
- 208 North St
- 77 Birchwood Dr
- 179 Wyman Rd
- 194 Dow Rd
Your Personal Tour Guide
Ask me questions while you tour the home.