23 Hager St Lancaster, PA 17603
Southside Lancaster NeighborhoodEstimated Value: $180,000 - $256,000
4
Beds
1
Bath
1,332
Sq Ft
$166/Sq Ft
Est. Value
About This Home
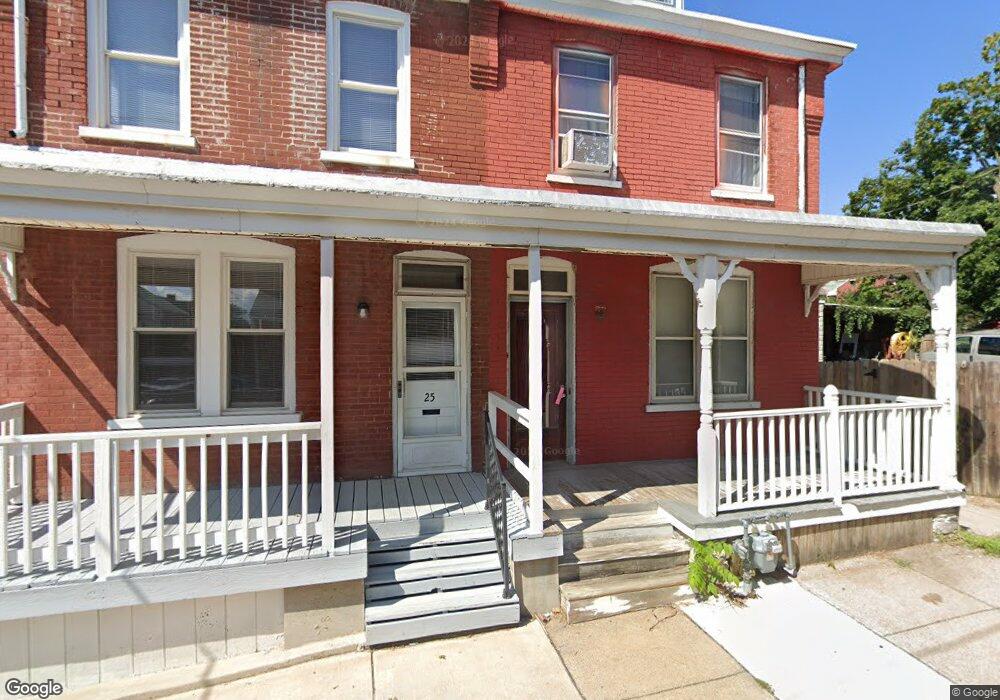
This home is located at 23 Hager St, Lancaster, PA 17603 and is currently estimated at $221,599, approximately $166 per square foot. 23 Hager St is a home located in Lancaster County with nearby schools including Price Elementary School, Jackson Middle School, and McCaskey High School.
Ownership History
Date
Name
Owned For
Owner Type
Purchase Details
Closed on
Oct 7, 2013
Sold by
The Bank Of New York Mellon Trust Compan
Bought by
Shade Raymond Joseph
Current Estimated Value
Home Financials for this Owner
Home Financials are based on the most recent Mortgage that was taken out on this home.
Original Mortgage
$12,000
Interest Rate
4.53%
Mortgage Type
New Conventional
Purchase Details
Closed on
Jul 31, 2013
Sold by
Gibson Ulysses and Gray Kevin E
Bought by
The Bank Of New York Mellon Trust Co and Jpmorgan Chase Bank Na
Create a Home Valuation Report for This Property
The Home Valuation Report is an in-depth analysis detailing your home's value as well as a comparison with similar homes in the area
Home Values in the Area
Average Home Value in this Area
Purchase History
| Date | Buyer | Sale Price | Title Company |
|---|---|---|---|
| Shade Raymond Joseph | $27,502 | None Available | |
| The Bank Of New York Mellon Trust Co | $3,366 | None Available |
Source: Public Records
Mortgage History
| Date | Status | Borrower | Loan Amount |
|---|---|---|---|
| Closed | Shade Raymond Joseph | $12,000 |
Source: Public Records
Tax History Compared to Growth
Tax History
| Year | Tax Paid | Tax Assessment Tax Assessment Total Assessment is a certain percentage of the fair market value that is determined by local assessors to be the total taxable value of land and additions on the property. | Land | Improvement |
|---|---|---|---|---|
| 2025 | $2,323 | $58,700 | $9,200 | $49,500 |
| 2024 | $2,323 | $58,700 | $9,200 | $49,500 |
| 2023 | $2,284 | $58,700 | $9,200 | $49,500 |
| 2022 | $2,189 | $58,700 | $9,200 | $49,500 |
| 2021 | $2,142 | $58,700 | $9,200 | $49,500 |
| 2020 | $2,142 | $58,700 | $9,200 | $49,500 |
| 2019 | $2,110 | $58,700 | $9,200 | $49,500 |
| 2018 | $1,119 | $58,700 | $9,200 | $49,500 |
| 2017 | $2,577 | $56,100 | $12,900 | $43,200 |
| 2016 | $2,553 | $56,100 | $12,900 | $43,200 |
| 2015 | $996 | $56,100 | $12,900 | $43,200 |
| 2014 | $2,228 | $56,100 | $12,900 | $43,200 |
Source: Public Records
Map
Nearby Homes
- 543 S Prince St
- 645 S Prince St
- 626 S Queen St
- 709 S Prince St
- 641 S Queen St
- 511 Beaver St
- 506 Beaver St
- 460 S Queen St
- 459 S Queen St
- 442 S Prince St
- 683 Fairview Ave
- 431 S Queen St
- 433 Hillside Ave
- 848 Garnet Ave
- 472 New Dorwart St
- 843 Lucilla Ct
- 348 S Prince St
- 346 S Prince St
- 445 New Dorwart St
- 555 Woodward St