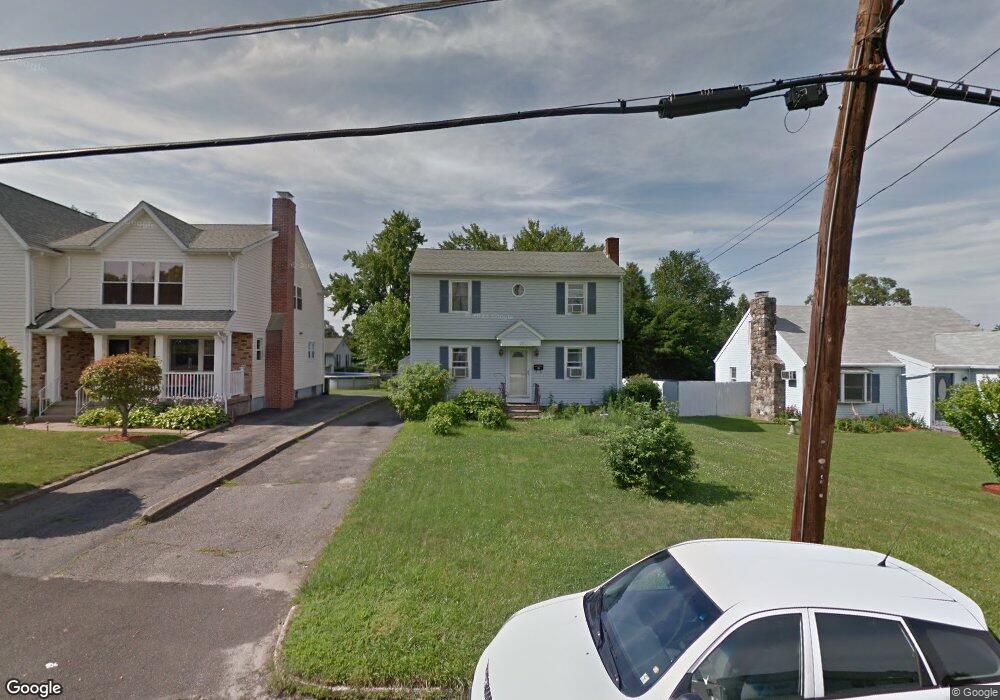
23 High St Danbury, CT 06810
Estimated Value: $393,940 - $509,000
3
Beds
2
Baths
1,412
Sq Ft
$317/Sq Ft
Est. Value
About This Home
This home is located at 23 High St, Danbury, CT 06810 and is currently estimated at $447,235, approximately $316 per square foot. 23 High St is a home located in Fairfield County with nearby schools including Shelter Rock School, Rogers Park Middle School, and Danbury High School.
Ownership History
Date
Name
Owned For
Owner Type
Purchase Details
Closed on
Jan 13, 1992
Sold by
Deaner Ross and Deaner Karen
Bought by
Moore Janice
Current Estimated Value
Home Financials for this Owner
Home Financials are based on the most recent Mortgage that was taken out on this home.
Original Mortgage
$13,000
Interest Rate
8.64%
Purchase Details
Closed on
Jul 10, 1987
Sold by
Kelley Michael
Bought by
Deaner Ross
Home Financials for this Owner
Home Financials are based on the most recent Mortgage that was taken out on this home.
Original Mortgage
$138,400
Interest Rate
10.71%
Create a Home Valuation Report for This Property
The Home Valuation Report is an in-depth analysis detailing your home's value as well as a comparison with similar homes in the area
Home Values in the Area
Average Home Value in this Area
Purchase History
| Date | Buyer | Sale Price | Title Company |
|---|---|---|---|
| Moore Janice | $148,000 | -- | |
| Deaner Ross | $173,000 | -- |
Source: Public Records
Mortgage History
| Date | Status | Borrower | Loan Amount |
|---|---|---|---|
| Closed | Deaner Ross | $84,000 | |
| Closed | Deaner Ross | $13,000 | |
| Previous Owner | Deaner Ross | $138,400 |
Source: Public Records
Tax History
| Year | Tax Paid | Tax Assessment Tax Assessment Total Assessment is a certain percentage of the fair market value that is determined by local assessors to be the total taxable value of land and additions on the property. | Land | Improvement |
|---|---|---|---|---|
| 2025 | $4,623 | $185,010 | $59,850 | $125,160 |
| 2024 | $4,522 | $185,010 | $59,850 | $125,160 |
| 2023 | $4,316 | $185,010 | $59,850 | $125,160 |
| 2022 | $4,193 | $148,600 | $62,000 | $86,600 |
| 2021 | $4,104 | $148,700 | $62,000 | $86,700 |
| 2020 | $4,104 | $148,700 | $62,000 | $86,700 |
| 2019 | $4,104 | $148,700 | $62,000 | $86,700 |
| 2018 | $4,104 | $148,700 | $62,000 | $86,700 |
| 2017 | $3,984 | $137,600 | $59,100 | $78,500 |
| 2016 | $3,946 | $137,600 | $59,100 | $78,500 |
| 2015 | $3,889 | $137,600 | $59,100 | $78,500 |
| 2014 | $3,798 | $137,600 | $59,100 | $78,500 |
Source: Public Records
Map
Nearby Homes
- 3 Balash Ln
- 79 Coalpit Hill Rd Unit 3
- 1 Lawrence Ave Unit 1
- 11 Mannions Ln Unit 11
- 72 Tucker St
- 10 Sampson Terrace
- 10 South St Unit 36
- 8 South St Unit 9
- 26 Mountainville Rd
- 175 South St
- 173 South St
- 18 Hudson St Unit 15
- 18 Hudson St Unit 21
- 15A Mountainville Rd
- 126 Triangle St Unit B43
- 35 Taylor St
- 81 Deer Hill Ave
- 37 Taylor St
- 19 Mcdermott St
- 31 Wildman St Unit 33
Your Personal Tour Guide
Ask me questions while you tour the home.