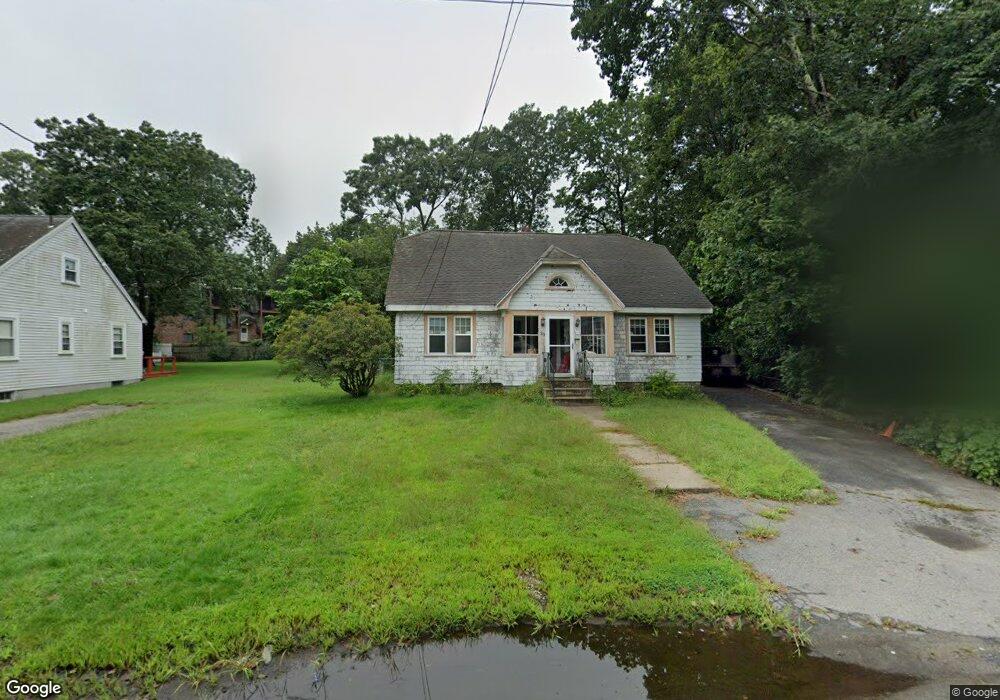
23 Holliston St Medway, MA 02053
Estimated Value: $624,020 - $721,000
3
Beds
2
Baths
2,184
Sq Ft
$310/Sq Ft
Est. Value
About This Home
This home is located at 23 Holliston St, Medway, MA 02053 and is currently estimated at $678,005, approximately $310 per square foot. 23 Holliston St is a home located in Norfolk County with nearby schools including John D. McGovern Elementary School, Burke-Memorial Elementary, and Medway Middle School.
Ownership History
Date
Name
Owned For
Owner Type
Purchase Details
Closed on
Jul 24, 2015
Sold by
Johnson Harry T and Johnson Jeanne W
Bought by
Harry T Johnson Jr Ft and Johnson Joshua A
Current Estimated Value
Purchase Details
Closed on
Nov 6, 2009
Sold by
Richardson Nick J
Bought by
Johnson Harry T and Johnson Jeanne E
Create a Home Valuation Report for This Property
The Home Valuation Report is an in-depth analysis detailing your home's value as well as a comparison with similar homes in the area
Home Values in the Area
Average Home Value in this Area
Purchase History
| Date | Buyer | Sale Price | Title Company |
|---|---|---|---|
| Harry T Johnson Jr Ft | -- | -- | |
| Johnson Harry T | $182,500 | -- |
Source: Public Records
Tax History Compared to Growth
Tax History
| Year | Tax Paid | Tax Assessment Tax Assessment Total Assessment is a certain percentage of the fair market value that is determined by local assessors to be the total taxable value of land and additions on the property. | Land | Improvement |
|---|---|---|---|---|
| 2025 | $7,706 | $540,800 | $263,600 | $277,200 |
| 2024 | $7,788 | $540,800 | $263,600 | $277,200 |
| 2023 | $7,391 | $463,700 | $227,100 | $236,600 |
| 2022 | $7,226 | $426,800 | $202,800 | $224,000 |
| 2021 | $6,778 | $388,200 | $182,500 | $205,700 |
| 2020 | $6,304 | $360,200 | $162,200 | $198,000 |
| 2019 | $6,058 | $357,000 | $162,200 | $194,800 |
| 2018 | $5,865 | $332,100 | $141,900 | $190,200 |
| 2017 | $5,715 | $318,900 | $131,800 | $187,100 |
| 2016 | $5,583 | $308,300 | $126,900 | $181,400 |
| 2015 | $5,186 | $284,300 | $119,600 | $164,700 |
| 2014 | -- | $261,600 | $116,900 | $144,700 |
Source: Public Records
Map
Nearby Homes
- 20 Broad St Unit 6
- 20 Broad St Unit A
- 20 Broad St Unit 4
- 14 Sanford St Unit 15
- 9 Sanford St
- 841 Lincoln St
- 50 Main St
- 280 Village St Unit D2
- 4 Shaw St
- 3 Meryl St
- 7 Gloucester Dr
- 22 Sunset Dr
- 0 Elm St
- 56 Fuller Place
- 106 Holliston St
- 2 Skyline Dr
- 12 Lovering St
- 14 Heritage Dr
- 16 Lexington Ln
- 36 Lovering St
- 21 Holliston St
- 22 Lovers Ln
- 18 Lovers Ln
- 19 Holliston St
- 20 Lovers Ln
- 16 Lovers Ln
- 24 Holliston St
- 2 Cassidy Ln Unit 9
- 2 Cassidy Ln Unit 7
- 22 Holliston St
- 24 Holliston St
- 14 Lovers Ln
- 2 Sanderson St
- 18 Holliston St
- 18 Holliston St Unit 2
- 21 Lovers Ln
- 3 Sanderson St
- 16 Holliston St
- 25 Holliston St
- 4 Cassidy Ln