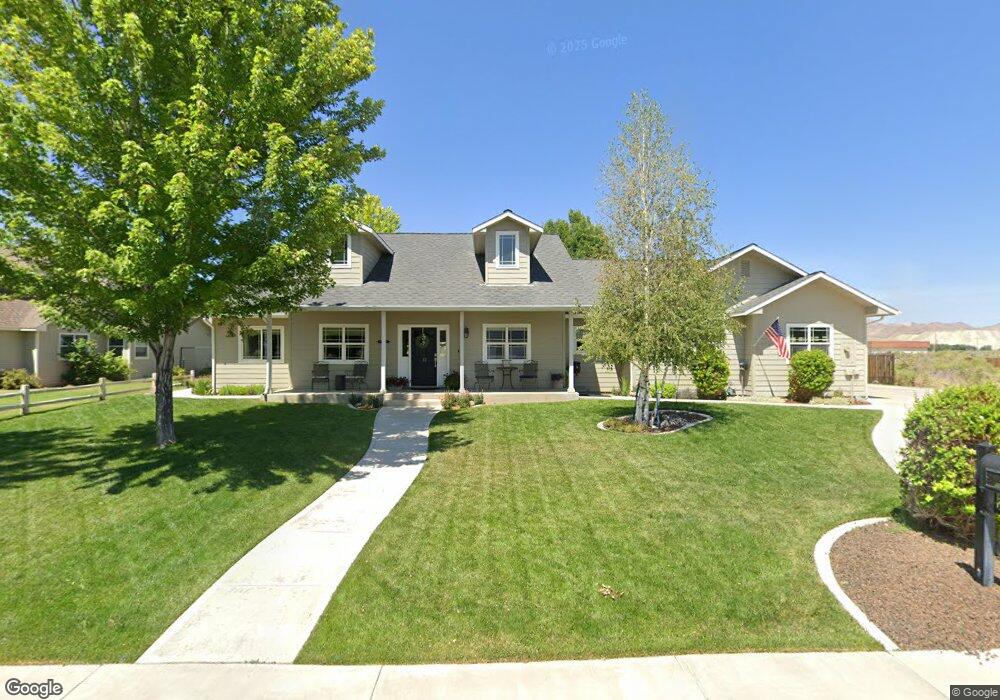
23 Jacob Rd Yerington, NV 89447
Estimated Value: $444,000 - $499,000
3
Beds
3
Baths
2,197
Sq Ft
$212/Sq Ft
Est. Value
About This Home
This home is located at 23 Jacob Rd, Yerington, NV 89447 and is currently estimated at $466,464, approximately $212 per square foot. 23 Jacob Rd is a home located in Lyon County with nearby schools including Yerington Elementary School, Yerington Intermediate School, and Yerington High School.
Ownership History
Date
Name
Owned For
Owner Type
Purchase Details
Closed on
Sep 20, 2019
Sold by
Lupori Theresa
Bought by
Lupori Theresa H and 2019 Theresa H Lupori Rlt
Current Estimated Value
Purchase Details
Closed on
Sep 9, 2011
Sold by
Lupori Edward
Bought by
Lupori Theresa
Purchase Details
Closed on
Aug 1, 2005
Sold by
Lupori Edward J and Lupori Theresa
Bought by
Lupori Edward and Lupori Theresa
Home Financials for this Owner
Home Financials are based on the most recent Mortgage that was taken out on this home.
Original Mortgage
$172,000
Interest Rate
5.48%
Mortgage Type
New Conventional
Create a Home Valuation Report for This Property
The Home Valuation Report is an in-depth analysis detailing your home's value as well as a comparison with similar homes in the area
Home Values in the Area
Average Home Value in this Area
Purchase History
| Date | Buyer | Sale Price | Title Company |
|---|---|---|---|
| Lupori Theresa H | -- | None Available | |
| Lupori Theresa | -- | None Available | |
| Lupori Edward | -- | Northern Nevada Title Co |
Source: Public Records
Mortgage History
| Date | Status | Borrower | Loan Amount |
|---|---|---|---|
| Closed | Lupori Edward | $172,000 |
Source: Public Records
Tax History Compared to Growth
Tax History
| Year | Tax Paid | Tax Assessment Tax Assessment Total Assessment is a certain percentage of the fair market value that is determined by local assessors to be the total taxable value of land and additions on the property. | Land | Improvement |
|---|---|---|---|---|
| 2025 | $3,849 | $144,787 | $33,250 | $111,537 |
| 2024 | $3,738 | $145,516 | $33,250 | $112,266 |
| 2023 | $3,738 | $136,374 | $31,500 | $104,874 |
| 2022 | $3,510 | $111,789 | $15,750 | $96,039 |
| 2021 | $3,403 | $103,125 | $9,275 | $93,850 |
| 2020 | $3,304 | $99,878 | $9,280 | $90,598 |
| 2019 | $3,208 | $96,427 | $9,280 | $87,147 |
| 2018 | $3,115 | $94,339 | $9,280 | $85,059 |
| 2017 | $3,024 | $94,297 | $9,280 | $85,017 |
| 2016 | $2,845 | $93,673 | $9,280 | $84,393 |
| 2015 | $2,840 | $78,550 | $9,280 | $69,270 |
| 2014 | $2,757 | $74,492 | $9,280 | $65,212 |
Source: Public Records
Map
Nearby Homes