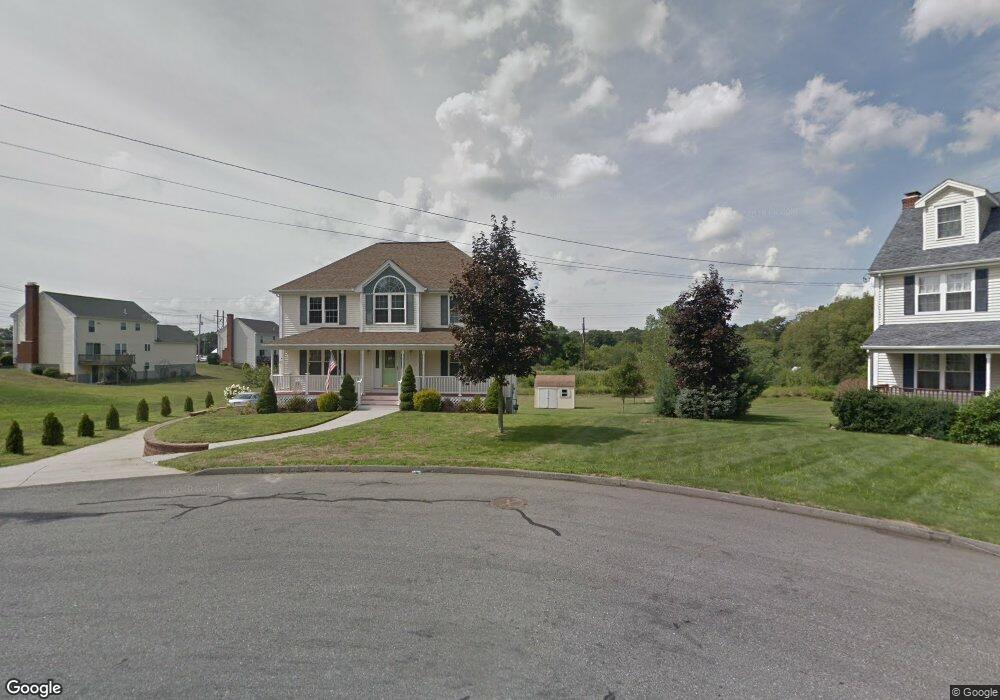
23 Jennie Way Attleboro, MA 02703
Estimated Value: $643,665 - $823,000
4
Beds
3
Baths
2,016
Sq Ft
$357/Sq Ft
Est. Value
About This Home
This home is located at 23 Jennie Way, Attleboro, MA 02703 and is currently estimated at $719,416, approximately $356 per square foot. 23 Jennie Way is a home located in Bristol County with nearby schools including Hill-Roberts Elementary School, Robert J. Coelho Middle School, and Attleboro High School.
Ownership History
Date
Name
Owned For
Owner Type
Purchase Details
Closed on
Jun 10, 2004
Sold by
Safeway Dev Corp
Bought by
Murray John E and Murray Veronica A
Current Estimated Value
Home Financials for this Owner
Home Financials are based on the most recent Mortgage that was taken out on this home.
Original Mortgage
$107,500
Outstanding Balance
$52,515
Interest Rate
5.99%
Mortgage Type
Purchase Money Mortgage
Estimated Equity
$666,901
Purchase Details
Closed on
Apr 30, 2004
Sold by
Safeway Dev Corp
Bought by
Schonhoff Stephen and Schonhoff Kerri
Home Financials for this Owner
Home Financials are based on the most recent Mortgage that was taken out on this home.
Original Mortgage
$107,500
Outstanding Balance
$52,515
Interest Rate
5.99%
Mortgage Type
Purchase Money Mortgage
Estimated Equity
$666,901
Purchase Details
Closed on
Aug 28, 2000
Sold by
Wb Const Dev Inc
Bought by
Patel Nalin
Home Financials for this Owner
Home Financials are based on the most recent Mortgage that was taken out on this home.
Original Mortgage
$100,000
Interest Rate
8.06%
Mortgage Type
Purchase Money Mortgage
Create a Home Valuation Report for This Property
The Home Valuation Report is an in-depth analysis detailing your home's value as well as a comparison with similar homes in the area
Home Values in the Area
Average Home Value in this Area
Purchase History
| Date | Buyer | Sale Price | Title Company |
|---|---|---|---|
| Murray John E | $412,500 | -- | |
| Schonhoff Stephen | $424,900 | -- | |
| Patel Nalin | $233,000 | -- |
Source: Public Records
Mortgage History
| Date | Status | Borrower | Loan Amount |
|---|---|---|---|
| Open | Murray John E | $107,500 | |
| Open | Schonhoff Stephen | $264,900 | |
| Previous Owner | Patel Nalin | $100,000 |
Source: Public Records
Tax History Compared to Growth
Tax History
| Year | Tax Paid | Tax Assessment Tax Assessment Total Assessment is a certain percentage of the fair market value that is determined by local assessors to be the total taxable value of land and additions on the property. | Land | Improvement |
|---|---|---|---|---|
| 2025 | $7,037 | $560,700 | $179,600 | $381,100 |
| 2024 | $6,643 | $521,800 | $162,200 | $359,600 |
| 2023 | $6,248 | $456,400 | $163,800 | $292,600 |
| 2022 | $5,985 | $414,200 | $156,400 | $257,800 |
| 2021 | $5,951 | $402,100 | $150,600 | $251,500 |
| 2020 | $5,668 | $389,300 | $144,000 | $245,300 |
| 2019 | $5,518 | $389,700 | $141,400 | $248,300 |
| 2018 | $5,338 | $360,200 | $137,400 | $222,800 |
| 2017 | $5,194 | $357,000 | $134,000 | $223,000 |
| 2016 | $5,025 | $339,100 | $125,700 | $213,400 |
| 2015 | $4,881 | $331,800 | $125,700 | $206,100 |
| 2014 | $4,805 | $323,600 | $120,200 | $203,400 |
Source: Public Records
Map
Nearby Homes
- 31 Jennie Way
- 1785 County St
- 22 Jennie Way
- 1791 County St
- 1779 County St
- 30 Jennie Way
- 1797 County St
- 1771 County St
- 1806 County St
- 30 Kensington Rd
- 1769 County St
- 1769 County St Unit 1
- 1774 County St
- 24 Kensington Rd
- 637 Read St
- 21 Kensington Rd
- 12 Kensington Rd
- 645 Read St
- 544 Read St
- 15 Kensington Rd