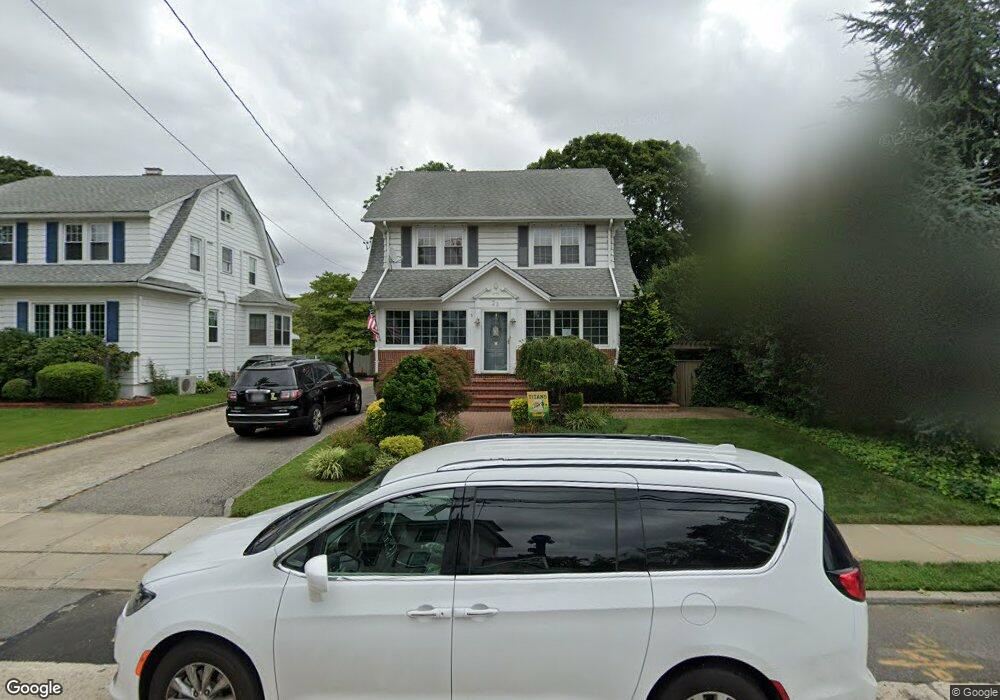
23 John St Lynbrook, NY 11563
Estimated Value: $800,374 - $868,000
Studio
1
Bath
1,822
Sq Ft
$458/Sq Ft
Est. Value
About This Home
This home is located at 23 John St, Lynbrook, NY 11563 and is currently estimated at $834,187, approximately $457 per square foot. 23 John St is a home located in Nassau County with nearby schools including Lynbrook Senior High School, Our Lady Of Peace School, and Valley Stream Christian Academy.
Ownership History
Date
Name
Owned For
Owner Type
Purchase Details
Closed on
Oct 11, 2016
Sold by
Quaranta Tobias A and Quaranta Linda P
Bought by
Kostkowicz John S and Kostkowicz Maria Ramaglia
Current Estimated Value
Home Financials for this Owner
Home Financials are based on the most recent Mortgage that was taken out on this home.
Original Mortgage
$441,900
Outstanding Balance
$353,816
Interest Rate
3.42%
Mortgage Type
New Conventional
Estimated Equity
$480,371
Purchase Details
Closed on
Mar 26, 2015
Sold by
Bonacci Eugene L and Bonacci Maureen B
Bought by
Quaranta Linda P and Quaranta Tobias A
Home Financials for this Owner
Home Financials are based on the most recent Mortgage that was taken out on this home.
Original Mortgage
$360,000
Interest Rate
3.77%
Mortgage Type
New Conventional
Purchase Details
Closed on
Nov 30, 2011
Sold by
Donato Lisa A and Donato Andrew
Bought by
Quaranta Tobias A and Bonacci Marueen
Purchase Details
Closed on
Jun 6, 2006
Sold by
Donato Anne
Create a Home Valuation Report for This Property
The Home Valuation Report is an in-depth analysis detailing your home's value as well as a comparison with similar homes in the area
Home Values in the Area
Average Home Value in this Area
Purchase History
| Date | Buyer | Sale Price | Title Company |
|---|---|---|---|
| Kostkowicz John S | $491,000 | Security Title Guarantee Cor | |
| Quaranta Linda P | -- | None Available | |
| Quaranta Tobias A | $385,000 | -- | |
| -- | -- | -- |
Source: Public Records
Mortgage History
| Date | Status | Borrower | Loan Amount |
|---|---|---|---|
| Open | Kostkowicz John S | $441,900 | |
| Previous Owner | Quaranta Linda P | $360,000 |
Source: Public Records
Tax History
| Year | Tax Paid | Tax Assessment Tax Assessment Total Assessment is a certain percentage of the fair market value that is determined by local assessors to be the total taxable value of land and additions on the property. | Land | Improvement |
|---|---|---|---|---|
| 2025 | $11,998 | $520 | $212 | $308 |
| 2024 | $1,178 | $546 | $223 | $323 |
Source: Public Records
Map
Nearby Homes
- 504 Merrick Rd Unit 4J
- 504 Merrick Rd Unit 4E
- 504 Merrick Rd Unit 2k
- 47 Wood St
- 2 Fowler Ave Unit 206
- 2 Fowler Ave Unit 228
- 57 Nieman Ave
- 3 Olive Place
- 20 Daley Place Unit 128
- 30 Daley Place Unit 247
- 20 Daley Place Unit 225
- 30 Daley Place Unit 146
- 232 Sherman St
- 12 Roxy Place
- 29 Summit Ave
- 181 Walnut St
- 40 Daley Place Unit 124
- 40 Daley Place Unit 227
- 75 Noble St Unit 126
- 75 Noble St Unit 121
Your Personal Tour Guide
Ask me questions while you tour the home.