Estimated Value: $360,000 - $371,000
2
Beds
2
Baths
958
Sq Ft
$381/Sq Ft
Est. Value
About This Home
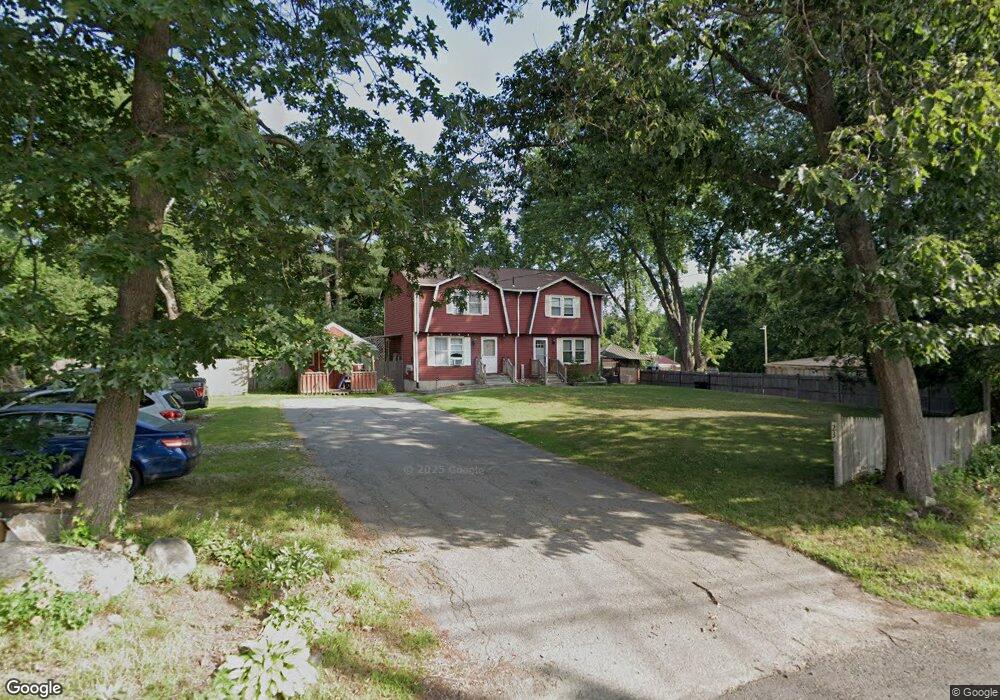
This home is located at 23 Kendall Pond Rd Unit L, Derry, NH 03038 and is currently estimated at $364,583, approximately $380 per square foot. 23 Kendall Pond Rd Unit L is a home located in Rockingham County with nearby schools including Grinnell School, Gilbert H. Hood Middle School, and Pinkerton Academy.
Ownership History
Date
Name
Owned For
Owner Type
Purchase Details
Closed on
Oct 10, 2020
Sold by
Reeves Walter J and Reeves Vicotria A
Bought by
Bolduc Case and Bolduc Meghan
Current Estimated Value
Home Financials for this Owner
Home Financials are based on the most recent Mortgage that was taken out on this home.
Original Mortgage
$218,500
Outstanding Balance
$193,990
Interest Rate
2.8%
Mortgage Type
New Conventional
Estimated Equity
$170,593
Purchase Details
Closed on
Feb 19, 2002
Sold by
Chamberlain Catherine E
Bought by
Reeves Walter J and Reeves Victoria A
Home Financials for this Owner
Home Financials are based on the most recent Mortgage that was taken out on this home.
Original Mortgage
$103,920
Interest Rate
7.14%
Create a Home Valuation Report for This Property
The Home Valuation Report is an in-depth analysis detailing your home's value as well as a comparison with similar homes in the area
Home Values in the Area
Average Home Value in this Area
Purchase History
| Date | Buyer | Sale Price | Title Company |
|---|---|---|---|
| Bolduc Case | $230,000 | None Available | |
| Reeves Walter J | $129,900 | -- |
Source: Public Records
Mortgage History
| Date | Status | Borrower | Loan Amount |
|---|---|---|---|
| Open | Bolduc Case | $218,500 | |
| Previous Owner | Reeves Walter J | $147,932 | |
| Previous Owner | Reeves Walter J | $22,000 | |
| Previous Owner | Reeves Walter J | $103,920 |
Source: Public Records
Tax History Compared to Growth
Tax History
| Year | Tax Paid | Tax Assessment Tax Assessment Total Assessment is a certain percentage of the fair market value that is determined by local assessors to be the total taxable value of land and additions on the property. | Land | Improvement |
|---|---|---|---|---|
| 2024 | $6,237 | $333,700 | $0 | $333,700 |
| 2023 | $4,744 | $229,400 | $0 | $229,400 |
| 2022 | $4,368 | $229,400 | $0 | $229,400 |
| 2021 | $4,234 | $171,000 | $0 | $171,000 |
| 2020 | $4,162 | $171,000 | $0 | $171,000 |
| 2019 | $4,038 | $154,600 | $91,900 | $62,700 |
| 2018 | $4,024 | $154,600 | $91,900 | $62,700 |
| 2017 | $4,332 | $150,100 | $87,300 | $62,800 |
| 2016 | $4,062 | $150,100 | $87,300 | $62,800 |
| 2015 | $3,473 | $118,800 | $65,500 | $53,300 |
| 2014 | $3,495 | $118,800 | $65,500 | $53,300 |
| 2013 | $3,719 | $118,100 | $64,100 | $54,000 |
Source: Public Records
Map
Nearby Homes
- 30 Kendall Pond Rd Unit 77
- 68 Fordway Extension
- 75 Fordway Extension
- 75.5 Fordway Extension
- 65 Fordway Extension Unit 4310
- 4 Norman Dr Unit L
- 11a Susan Dr Unit 11R aka 11A
- 13 Tiger Tail Cir
- 6 Michael Ave
- 25 Tiger Tail Cir Unit R
- 8 Blueberry Rd Unit R
- 29 Fordway St
- 9 Stonegate Ln
- 3 Nutfield Ct Unit 2
- 16 Blackberry Rd Unit L
- 90L Derryfield Rd
- 90 Derryfield Rd
- 90L Derryfield Rd Unit L
- 90 Derryfield Rd Unit R
- 36 Stonegate Ln
- 23 Kendall Pond Rd Unit R
- 23R Kendall Pond Rd
- 23R Kendall Pond Rd Unit R
- 23 Kendall Pond Rd
- 21 Kendall Pond Rd
- 26 Pinehurst Ave
- 30 Kendall Pond Rd Unit 25
- 30 Kendall Pond Rd Unit 98
- 30 Kendall Pond Rd Unit 94
- 30 Kendall Pond Rd Unit 15
- 30 Kendall Pond Rd Unit 28
- 30 Kendall Pond Rd Unit R 110
- 30 Kendall Pond Rd Unit 44-R113
- 30 Kendall Pond Rd
- 30 Kendall Pond Rd Unit 31
- 30 Kendall Pond Rd Unit R365
- 30 Kendall Pond Rd Unit R378
- 30 Kendall Pond Rd Unit 3 Lane
- 30 Kendall Pond Rd Unit Lot 38
- 30 Kendall Pond Rd