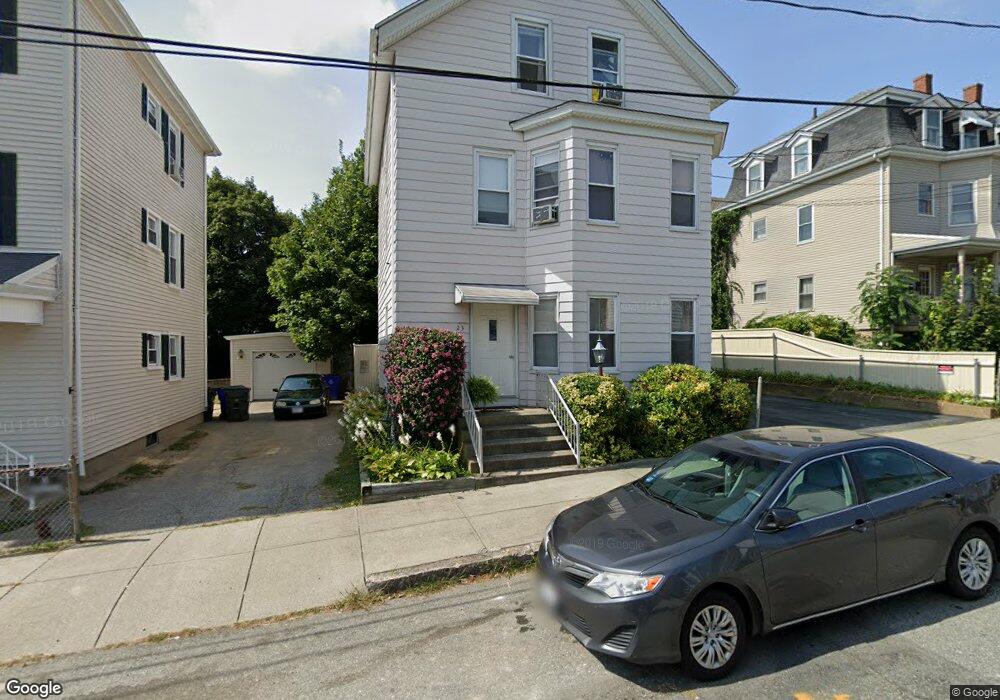
23 Lapham St Fall River, MA 02721
Niagara NeighborhoodEstimated Value: $459,000 - $542,000
4
Beds
3
Baths
1,810
Sq Ft
$269/Sq Ft
Est. Value
About This Home
This home is located at 23 Lapham St, Fall River, MA 02721 and is currently estimated at $487,667, approximately $269 per square foot. 23 Lapham St is a home located in Bristol County with nearby schools including William S Greene, Matthew J. Kuss Middle School, and B M C Durfee High School.
Ownership History
Date
Name
Owned For
Owner Type
Purchase Details
Closed on
Jun 30, 2021
Sold by
Defarias Mark S and Defarias Catherine A
Bought by
Defarias Lt and Defarias
Current Estimated Value
Purchase Details
Closed on
Apr 17, 1998
Sold by
Brooks Grace V and Brooks Virginia
Bought by
Defarias Mark S and Defarias Catherine
Create a Home Valuation Report for This Property
The Home Valuation Report is an in-depth analysis detailing your home's value as well as a comparison with similar homes in the area
Home Values in the Area
Average Home Value in this Area
Purchase History
| Date | Buyer | Sale Price | Title Company |
|---|---|---|---|
| Defarias Lt | -- | None Available | |
| Defarias Lt | -- | None Available | |
| Defarias Mark S | $20,000 | -- | |
| Defarias Mark S | $20,000 | -- |
Source: Public Records
Mortgage History
| Date | Status | Borrower | Loan Amount |
|---|---|---|---|
| Previous Owner | Defarias Mark S | $100,000 |
Source: Public Records
Tax History
| Year | Tax Paid | Tax Assessment Tax Assessment Total Assessment is a certain percentage of the fair market value that is determined by local assessors to be the total taxable value of land and additions on the property. | Land | Improvement |
|---|---|---|---|---|
| 2025 | $3,991 | $348,600 | $104,800 | $243,800 |
| 2024 | $3,160 | $275,000 | $101,000 | $174,000 |
| 2023 | $2,805 | $228,600 | $83,400 | $145,200 |
| 2022 | $2,610 | $206,800 | $79,400 | $127,400 |
| 2021 | $2,447 | $176,900 | $75,600 | $101,300 |
| 2020 | $2,240 | $155,000 | $74,500 | $80,500 |
| 2019 | $2,129 | $146,000 | $71,700 | $74,300 |
| 2018 | $2,137 | $146,200 | $77,700 | $68,500 |
| 2017 | $1,939 | $138,500 | $74,000 | $64,500 |
| 2016 | $1,929 | $141,500 | $78,800 | $62,700 |
| 2015 | $1,851 | $141,500 | $78,800 | $62,700 |
| 2014 | $1,827 | $145,200 | $76,500 | $68,700 |
Source: Public Records
Map
Nearby Homes
- 405 Warren St
- 472 Buffinton St
- 304 Cambridge St
- 71 Smith St
- 472 Buffinton St (Ns)
- 11 Foster St
- 364 Tecumseh St
- 231 Lapham St
- 94 Snell St
- 188-194 Nashua St
- 000 Lawrence St
- 1-11 Lawrence St
- 1 Lawrence St Unit 1
- 132 Lonsdale St
- 311 S Oxford St
- 1350 Rodman St
- 20 Reeves St
- 766 Second St
- 21 Boyden St
- 545 Brayton Ave
Your Personal Tour Guide
Ask me questions while you tour the home.