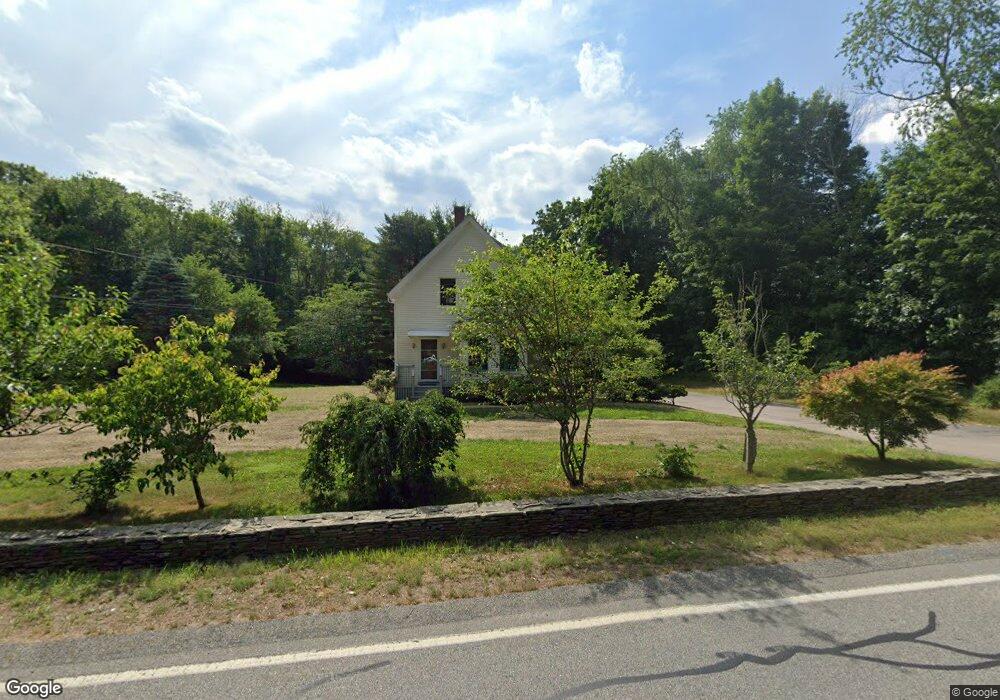
23 Laurel St East Bridgewater, MA 02333
Estimated Value: $528,000 - $601,000
3
Beds
3
Baths
1,132
Sq Ft
$489/Sq Ft
Est. Value
About This Home
This home is located at 23 Laurel St, East Bridgewater, MA 02333 and is currently estimated at $553,016, approximately $488 per square foot. 23 Laurel St is a home located in Plymouth County with nearby schools including Central Elementary School, Gordon W Mitchell Middle School, and East Bridgewater Jr./Sr. High School.
Ownership History
Date
Name
Owned For
Owner Type
Purchase Details
Closed on
Jan 28, 2021
Sold by
Morton Catherine J and Morton Glen D
Bought by
Willis Corey G
Current Estimated Value
Home Financials for this Owner
Home Financials are based on the most recent Mortgage that was taken out on this home.
Original Mortgage
$336,500
Outstanding Balance
$300,806
Interest Rate
2.67%
Mortgage Type
Purchase Money Mortgage
Estimated Equity
$252,210
Purchase Details
Closed on
Sep 30, 1997
Sold by
Gurney Clinton H and Gurney Betty H
Bought by
Maroon Catherine J
Create a Home Valuation Report for This Property
The Home Valuation Report is an in-depth analysis detailing your home's value as well as a comparison with similar homes in the area
Home Values in the Area
Average Home Value in this Area
Purchase History
| Date | Buyer | Sale Price | Title Company |
|---|---|---|---|
| Willis Corey G | $400,000 | None Available | |
| Maroon Catherine J | $146,000 | -- |
Source: Public Records
Mortgage History
| Date | Status | Borrower | Loan Amount |
|---|---|---|---|
| Open | Willis Corey G | $336,500 | |
| Previous Owner | Maroon Catherine J | $150,000 | |
| Previous Owner | Maroon Catherine J | $25,000 | |
| Previous Owner | Maroon Catherine J | $70,000 |
Source: Public Records
Tax History Compared to Growth
Tax History
| Year | Tax Paid | Tax Assessment Tax Assessment Total Assessment is a certain percentage of the fair market value that is determined by local assessors to be the total taxable value of land and additions on the property. | Land | Improvement |
|---|---|---|---|---|
| 2025 | $6,310 | $461,600 | $180,500 | $281,100 |
| 2024 | $6,196 | $447,700 | $173,600 | $274,100 |
| 2023 | $6,076 | $420,500 | $173,600 | $246,900 |
| 2022 | $5,800 | $371,800 | $157,900 | $213,900 |
| 2021 | $5,545 | $325,200 | $151,700 | $173,500 |
| 2020 | $5,408 | $312,800 | $145,900 | $166,900 |
| 2019 | $5,280 | $300,700 | $139,500 | $161,200 |
| 2018 | $5,155 | $287,000 | $139,500 | $147,500 |
| 2017 | $5,009 | $273,700 | $133,000 | $140,700 |
| 2016 | $4,871 | $268,200 | $133,000 | $135,200 |
| 2015 | $4,751 | $267,500 | $132,100 | $135,400 |
| 2014 | $4,560 | $262,500 | $129,300 | $133,200 |
Source: Public Records
Map
Nearby Homes