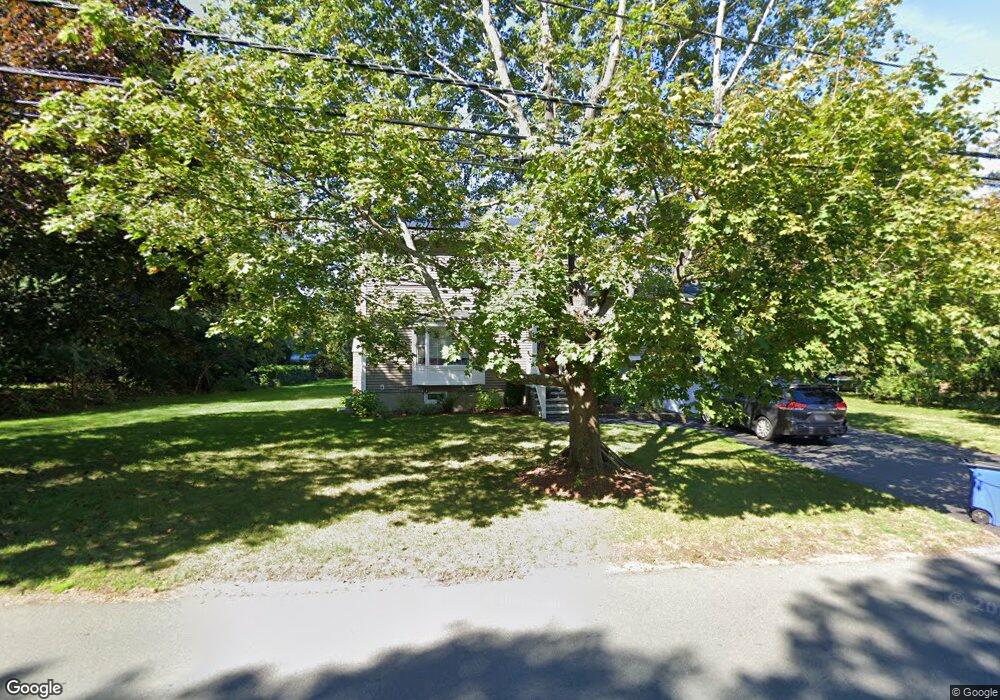
23 Lillian Rd Lexington, MA 02420
East Lexington NeighborhoodEstimated Value: $1,390,000 - $1,682,842
3
Beds
2
Baths
1,840
Sq Ft
$838/Sq Ft
Est. Value
About This Home
This home is located at 23 Lillian Rd, Lexington, MA 02420 and is currently estimated at $1,542,211, approximately $838 per square foot. 23 Lillian Rd is a home located in Middlesex County with nearby schools including Harrington Elementary School, Jonas Clarke Middle School, and Lexington High School.
Ownership History
Date
Name
Owned For
Owner Type
Purchase Details
Closed on
Aug 27, 2012
Sold by
Cheng Wai Y and Cheng Kelly L
Bought by
Cheng Wai Y and Cheng Kelly L
Current Estimated Value
Purchase Details
Closed on
Jun 28, 2010
Sold by
Lee Won Yong and Lee Sun Ok
Bought by
Kwan Kelly and Cheng Wai Yin
Home Financials for this Owner
Home Financials are based on the most recent Mortgage that was taken out on this home.
Original Mortgage
$417,000
Interest Rate
4.98%
Mortgage Type
Purchase Money Mortgage
Purchase Details
Closed on
May 18, 2001
Sold by
Sindoris Mary C Est
Bought by
Lee Won Yong and Lee Sun Ok
Home Financials for this Owner
Home Financials are based on the most recent Mortgage that was taken out on this home.
Original Mortgage
$330,000
Interest Rate
7.03%
Mortgage Type
Purchase Money Mortgage
Create a Home Valuation Report for This Property
The Home Valuation Report is an in-depth analysis detailing your home's value as well as a comparison with similar homes in the area
Home Values in the Area
Average Home Value in this Area
Purchase History
| Date | Buyer | Sale Price | Title Company |
|---|---|---|---|
| Cheng Wai Y | -- | -- | |
| Kwan Kelly | $610,000 | -- | |
| Lee Won Yong | $455,000 | -- |
Source: Public Records
Mortgage History
| Date | Status | Borrower | Loan Amount |
|---|---|---|---|
| Previous Owner | Lee Won Yong | $415,000 | |
| Previous Owner | Kwan Kelly | $417,000 | |
| Previous Owner | Lee Won Yong | $46,500 | |
| Previous Owner | Lee Won Yong | $330,000 |
Source: Public Records
Tax History
| Year | Tax Paid | Tax Assessment Tax Assessment Total Assessment is a certain percentage of the fair market value that is determined by local assessors to be the total taxable value of land and additions on the property. | Land | Improvement |
|---|---|---|---|---|
| 2025 | $17,599 | $1,439,000 | $711,000 | $728,000 |
| 2024 | $17,187 | $1,403,000 | $677,000 | $726,000 |
| 2023 | $16,263 | $1,251,000 | $615,000 | $636,000 |
| 2022 | $15,014 | $1,088,000 | $560,000 | $528,000 |
| 2021 | $14,951 | $1,039,000 | $533,000 | $506,000 |
| 2020 | $14,823 | $1,055,000 | $533,000 | $522,000 |
| 2019 | $14,318 | $1,014,000 | $507,000 | $507,000 |
| 2018 | $14,028 | $981,000 | $483,000 | $498,000 |
| 2017 | $13,490 | $931,000 | $446,000 | $485,000 |
| 2016 | $13,140 | $900,000 | $424,000 | $476,000 |
| 2015 | $11,665 | $785,000 | $386,000 | $399,000 |
| 2014 | $9,027 | $582,000 | $343,000 | $239,000 |
Source: Public Records
Map
Nearby Homes
Your Personal Tour Guide
Ask me questions while you tour the home.