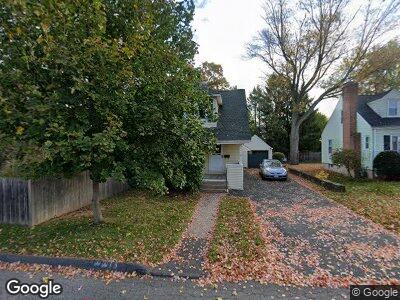
23 Lyness St Manchester, CT 06040
Verplanck NeighborhoodEstimated Value: $313,000 - $398,000
3
Beds
2
Baths
1,597
Sq Ft
$216/Sq Ft
Est. Value
About This Home
This home is located at 23 Lyness St, Manchester, CT 06040 and is currently estimated at $344,184, approximately $215 per square foot. 23 Lyness St is a home located in Hartford County with nearby schools including Verplanck School, Elisabeth M. Bennet Academy, and Illing Middle School.
Ownership History
Date
Name
Owned For
Owner Type
Purchase Details
Closed on
Apr 11, 2003
Sold by
Lappen Priscilla L and Gillespie Linda
Bought by
Sowa Stanley
Current Estimated Value
Home Financials for this Owner
Home Financials are based on the most recent Mortgage that was taken out on this home.
Original Mortgage
$100,000
Outstanding Balance
$45,174
Interest Rate
5.86%
Estimated Equity
$281,110
Create a Home Valuation Report for This Property
The Home Valuation Report is an in-depth analysis detailing your home's value as well as a comparison with similar homes in the area
Home Values in the Area
Average Home Value in this Area
Purchase History
| Date | Buyer | Sale Price | Title Company |
|---|---|---|---|
| Sowa Stanley | $161,000 | -- | |
| Sowa Stanley | $161,000 | -- |
Source: Public Records
Mortgage History
| Date | Status | Borrower | Loan Amount |
|---|---|---|---|
| Open | Sowa Stanley | $100,000 | |
| Closed | Sowa Stanley | $100,000 |
Source: Public Records
Tax History Compared to Growth
Tax History
| Year | Tax Paid | Tax Assessment Tax Assessment Total Assessment is a certain percentage of the fair market value that is determined by local assessors to be the total taxable value of land and additions on the property. | Land | Improvement |
|---|---|---|---|---|
| 2024 | $5,462 | $141,200 | $39,800 | $101,400 |
| 2023 | $5,253 | $141,200 | $39,800 | $101,400 |
| 2022 | $5,100 | $141,200 | $39,800 | $101,400 |
| 2021 | $4,948 | $118,000 | $34,200 | $83,800 |
| 2020 | $4,941 | $118,000 | $34,200 | $83,800 |
| 2019 | $4,921 | $118,000 | $34,200 | $83,800 |
| 2018 | $4,827 | $118,000 | $34,200 | $83,800 |
| 2017 | $4,691 | $118,000 | $34,200 | $83,800 |
| 2016 | $5,083 | $128,100 | $43,300 | $84,800 |
| 2015 | $5,047 | $128,100 | $43,300 | $84,800 |
| 2014 | $4,951 | $128,100 | $43,300 | $84,800 |
Source: Public Records
Map
Nearby Homes