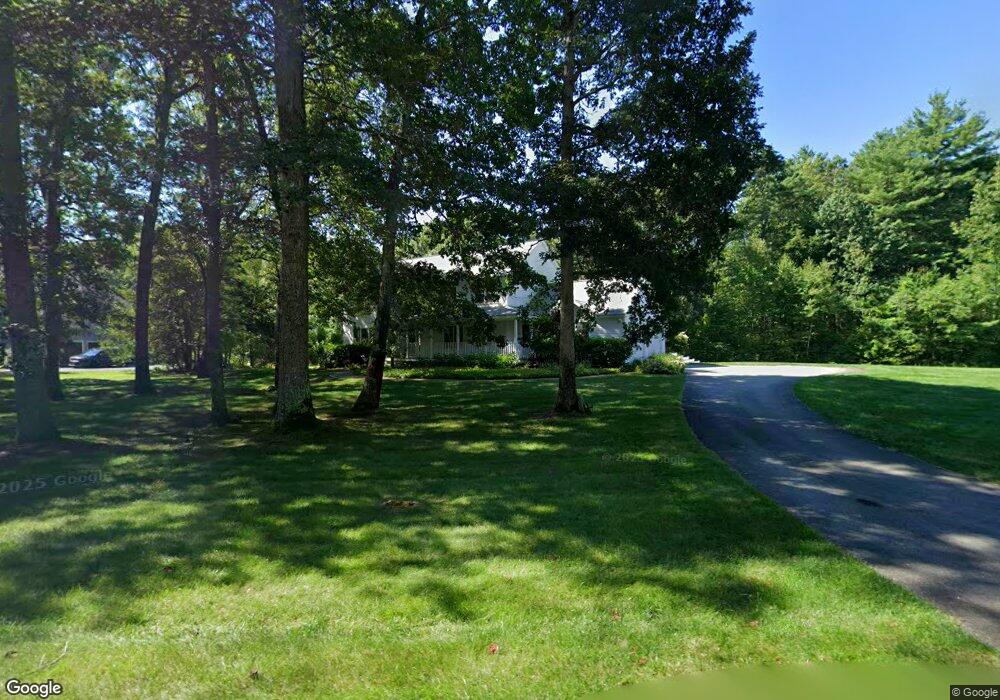
23 Lynne Dr Hollis, NH 03049
Hollis NeighborhoodEstimated Value: $898,849 - $1,088,000
4
Beds
3
Baths
2,792
Sq Ft
$360/Sq Ft
Est. Value
About This Home
This home is located at 23 Lynne Dr, Hollis, NH 03049 and is currently estimated at $1,006,212, approximately $360 per square foot. 23 Lynne Dr is a home with nearby schools including Hollis Primary School, Hollis Upper Elementary School, and Hollis-Brookline Middle School.
Ownership History
Date
Name
Owned For
Owner Type
Purchase Details
Closed on
Aug 1, 2016
Sold by
Cahill Paul M and Cahill Kathleen M
Bought by
Cahill Ft
Current Estimated Value
Purchase Details
Closed on
Mar 1, 1996
Sold by
Adamyk Homes Inc
Bought by
Cahill Paul M and Cahill Kathleen M
Home Financials for this Owner
Home Financials are based on the most recent Mortgage that was taken out on this home.
Original Mortgage
$200,000
Interest Rate
7.02%
Create a Home Valuation Report for This Property
The Home Valuation Report is an in-depth analysis detailing your home's value as well as a comparison with similar homes in the area
Home Values in the Area
Average Home Value in this Area
Purchase History
| Date | Buyer | Sale Price | Title Company |
|---|---|---|---|
| Cahill Ft | -- | -- | |
| Cahill Paul M | $280,800 | -- |
Source: Public Records
Mortgage History
| Date | Status | Borrower | Loan Amount |
|---|---|---|---|
| Previous Owner | Cahill Paul M | $391,000 | |
| Previous Owner | Cahill Paul M | $395,250 | |
| Previous Owner | Cahill Paul M | $200,000 |
Source: Public Records
Tax History Compared to Growth
Tax History
| Year | Tax Paid | Tax Assessment Tax Assessment Total Assessment is a certain percentage of the fair market value that is determined by local assessors to be the total taxable value of land and additions on the property. | Land | Improvement |
|---|---|---|---|---|
| 2024 | $14,487 | $817,100 | $292,600 | $524,500 |
| 2023 | $13,613 | $817,100 | $292,600 | $524,500 |
| 2022 | $18,442 | $817,100 | $292,600 | $524,500 |
| 2021 | $11,877 | $523,200 | $187,700 | $335,500 |
| 2020 | $12,260 | $528,900 | $187,700 | $341,200 |
| 2019 | $12,218 | $528,900 | $187,700 | $341,200 |
| 2018 | $11,031 | $528,900 | $187,700 | $341,200 |
| 2017 | $11,098 | $479,400 | $162,400 | $317,000 |
| 2016 | $11,232 | $479,400 | $162,400 | $317,000 |
| 2015 | $11,036 | $479,400 | $162,400 | $317,000 |
| 2014 | $11,089 | $479,400 | $162,400 | $317,000 |
| 2013 | $10,709 | $469,300 | $162,400 | $306,900 |
Source: Public Records
Map
Nearby Homes