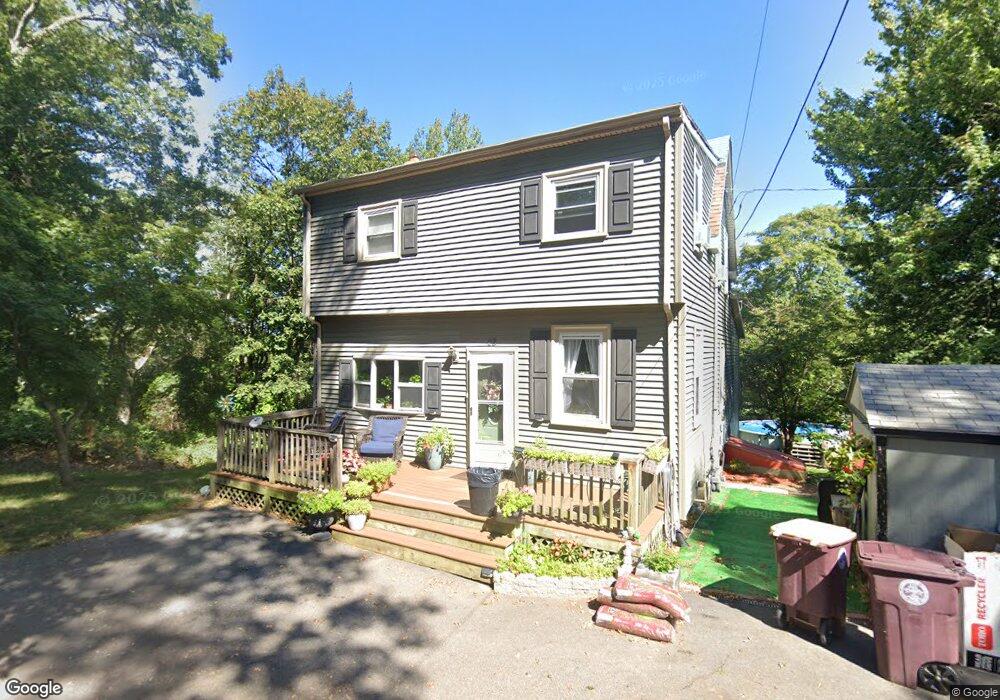
23 Mace Ave East Weymouth, MA 02189
East Weymouth NeighborhoodEstimated Value: $568,000 - $725,005
4
Beds
1
Bath
1,375
Sq Ft
$487/Sq Ft
Est. Value
About This Home
This home is located at 23 Mace Ave, East Weymouth, MA 02189 and is currently estimated at $669,501, approximately $486 per square foot. 23 Mace Ave is a home located in Norfolk County with nearby schools including William Seach Elementary School, Abigail Adams Middle School, and Weymouth Middle School Chapman.
Ownership History
Date
Name
Owned For
Owner Type
Purchase Details
Closed on
Sep 30, 1998
Sold by
Murphy George B and Murphy Mary C
Bought by
Brennan Eileen and Brennan Margaret
Current Estimated Value
Home Financials for this Owner
Home Financials are based on the most recent Mortgage that was taken out on this home.
Original Mortgage
$90,700
Interest Rate
6.89%
Mortgage Type
Purchase Money Mortgage
Create a Home Valuation Report for This Property
The Home Valuation Report is an in-depth analysis detailing your home's value as well as a comparison with similar homes in the area
Home Values in the Area
Average Home Value in this Area
Purchase History
| Date | Buyer | Sale Price | Title Company |
|---|---|---|---|
| Brennan Eileen | $126,000 | -- |
Source: Public Records
Mortgage History
| Date | Status | Borrower | Loan Amount |
|---|---|---|---|
| Open | Brennan Eileen | $131,000 | |
| Closed | Brennan Eileen | $90,700 |
Source: Public Records
Tax History Compared to Growth
Tax History
| Year | Tax Paid | Tax Assessment Tax Assessment Total Assessment is a certain percentage of the fair market value that is determined by local assessors to be the total taxable value of land and additions on the property. | Land | Improvement |
|---|---|---|---|---|
| 2025 | $6,522 | $645,700 | $229,900 | $415,800 |
| 2024 | $6,317 | $615,100 | $219,000 | $396,100 |
| 2023 | $5,800 | $555,000 | $202,800 | $352,200 |
| 2022 | $5,692 | $496,700 | $187,800 | $308,900 |
| 2021 | $5,438 | $463,200 | $187,800 | $275,400 |
| 2020 | $5,147 | $431,800 | $178,400 | $253,400 |
| 2019 | $4,911 | $405,200 | $162,600 | $242,600 |
| 2018 | $4,748 | $379,800 | $154,800 | $225,000 |
| 2017 | $4,676 | $365,000 | $147,500 | $217,500 |
| 2016 | $4,493 | $351,000 | $141,800 | $209,200 |
| 2015 | $4,287 | $332,300 | $141,800 | $190,500 |
| 2014 | $4,139 | $311,200 | $132,000 | $179,200 |
Source: Public Records
Map
Nearby Homes
- 25 Echo Ave
- 211 Lake Shore Dr
- 215 Winter St Unit 1P
- 209 Lake Shore Dr
- 966 Washington St Unit 2
- 747 Middle St
- 1015 Washington St
- 16 Oak Cliff Rd
- 449 Middle St
- 10 Chapman St Unit 202
- 2 Tara Dr Unit 1
- 209 Lake St Unit 69
- 14 Old Stone Way Unit 11
- 42 Sundin Rd
- 131 Mutton Ln
- 303 Middle St
- 191 Tall Oaks Dr Unit C
- 675 Pleasant St Unit 8
- 955 Pleasant St Unit 11
- 200 Burkhall St Unit 803
- 15 Mace Ave
- 848 Washington St
- 848 Washington St Unit 1
- 850 Washington St
- 850 Washington St Unit 1
- 844 Washington St
- 850 Washington St Rt 53 Unit E
- 28 Stillman St
- 20 Stillman St
- 32 Beecher St
- 872 Washington St
- 34 Stillman St
- 839 Washington St
- 31 Beecher St
- 855 Washington St
- 27 Stillman St
- 841 Washington St
- 841 Washington St Unit 841
- 884 Washington St
- 21 Stillman St