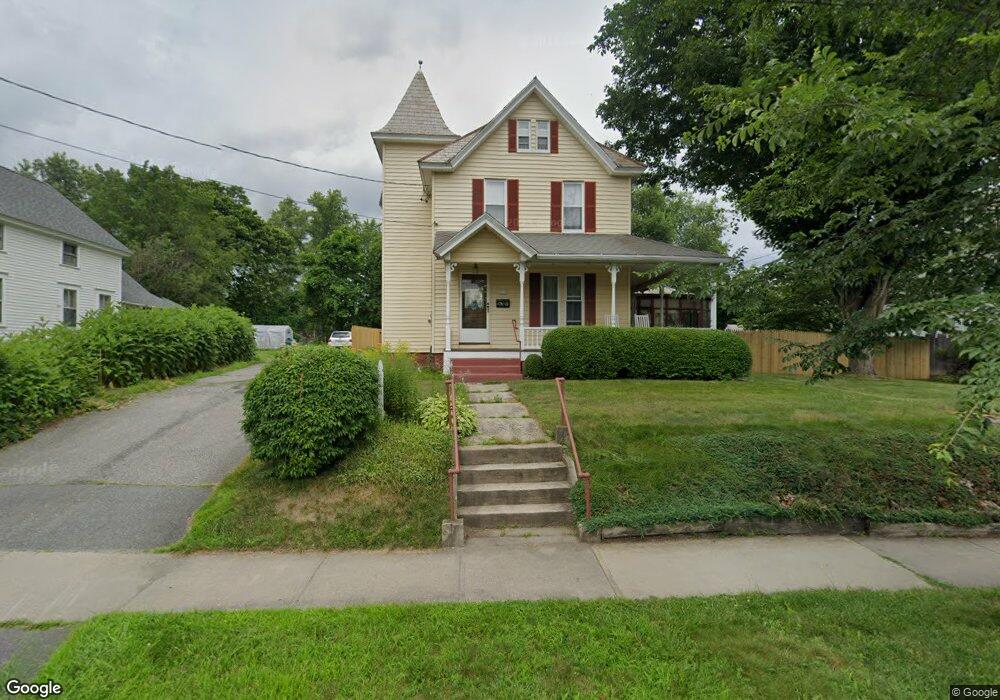
23 Maple St Greenfield, MA 01301
Estimated Value: $387,785 - $488,000
4
Beds
2
Baths
2,376
Sq Ft
$179/Sq Ft
Est. Value
About This Home
This home is located at 23 Maple St, Greenfield, MA 01301 and is currently estimated at $425,196, approximately $178 per square foot. 23 Maple St is a home located in Franklin County with nearby schools including Holy Trinity School and Cornerstone Christian School.
Ownership History
Date
Name
Owned For
Owner Type
Purchase Details
Closed on
Aug 29, 2002
Sold by
Hedden Charles L
Bought by
Mcleod Donald R and Mcleod Doris A
Current Estimated Value
Purchase Details
Closed on
May 1, 2000
Sold by
Warchut Michael W and Warchut Dorene Ann
Bought by
Hedden Charles L
Purchase Details
Closed on
May 11, 1994
Sold by
Depalma Robert A
Bought by
Warchut Michael W and Warchut Dorene Ann
Purchase Details
Closed on
Jun 15, 1993
Sold by
Frederick P Est Burke and Reid Roger J
Bought by
Depalma Robert
Create a Home Valuation Report for This Property
The Home Valuation Report is an in-depth analysis detailing your home's value as well as a comparison with similar homes in the area
Home Values in the Area
Average Home Value in this Area
Purchase History
| Date | Buyer | Sale Price | Title Company |
|---|---|---|---|
| Mcleod Donald R | $162,000 | -- | |
| Mcleod Donald R | $162,000 | -- | |
| Hedden Charles L | $132,000 | -- | |
| Hedden Charles L | $132,000 | -- | |
| Warchut Michael W | $108,000 | -- | |
| Warchut Michael W | $108,000 | -- | |
| Depalma Robert | $34,000 | -- |
Source: Public Records
Mortgage History
| Date | Status | Borrower | Loan Amount |
|---|---|---|---|
| Open | Depalma Robert | $120,600 | |
| Closed | Depalma Robert | $131,000 |
Source: Public Records
Tax History
| Year | Tax Paid | Tax Assessment Tax Assessment Total Assessment is a certain percentage of the fair market value that is determined by local assessors to be the total taxable value of land and additions on the property. | Land | Improvement |
|---|---|---|---|---|
| 2025 | $6,306 | $322,400 | $69,800 | $252,600 |
| 2024 | $7,663 | $375,800 | $57,400 | $318,400 |
| 2023 | $6,848 | $348,500 | $57,400 | $291,100 |
| 2022 | $6,560 | $293,900 | $54,700 | $239,200 |
| 2021 | $6,144 | $264,600 | $54,700 | $209,900 |
| 2020 | $5,703 | $248,700 | $54,700 | $194,000 |
| 2019 | $5,400 | $241,500 | $47,500 | $194,000 |
| 2018 | $5,307 | $236,600 | $46,500 | $190,100 |
| 2017 | $5,141 | $236,600 | $46,500 | $190,100 |
| 2016 | $5,221 | $239,400 | $49,200 | $190,200 |
| 2015 | $5,272 | $234,200 | $49,200 | $185,000 |
| 2014 | $4,810 | $234,300 | $49,200 | $185,100 |
Source: Public Records
Map
Nearby Homes
Your Personal Tour Guide
Ask me questions while you tour the home.