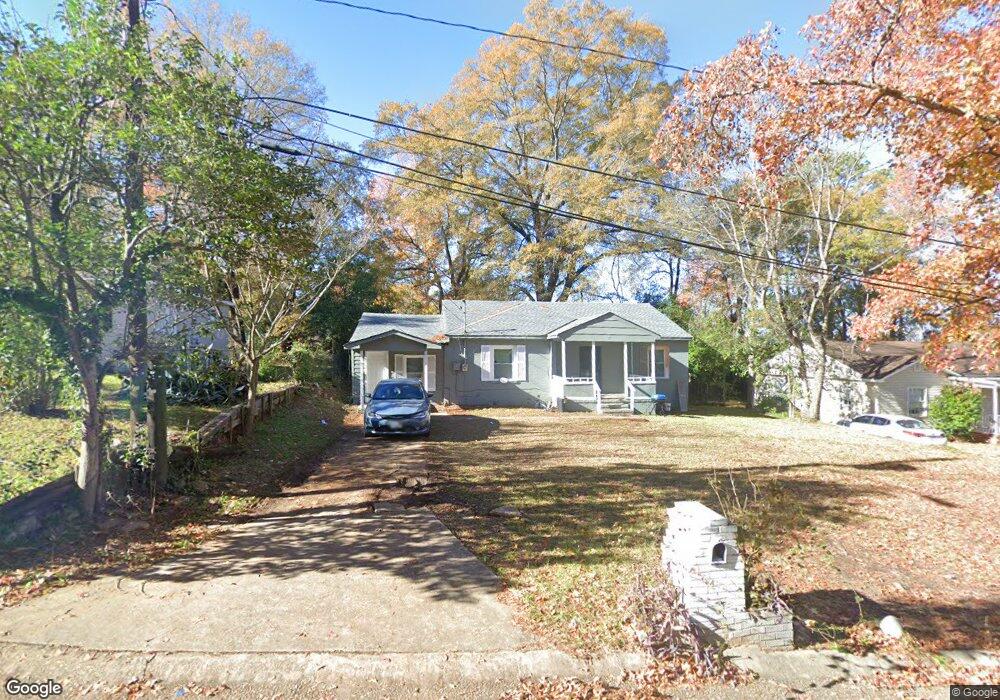
23 Mason Dr Columbus, GA 31903
Southern Columbus NeighborhoodEstimated Value: $70,000 - $120,000
3
Beds
2
Baths
1,506
Sq Ft
$56/Sq Ft
Est. Value
About This Home
This home is located at 23 Mason Dr, Columbus, GA 31903 and is currently estimated at $83,847, approximately $55 per square foot. 23 Mason Dr is a home located in Muscogee County with nearby schools including Glenallen Elementary School, South Columbus Elementary School, and Eddy Middle School.
Ownership History
Date
Name
Owned For
Owner Type
Purchase Details
Closed on
Mar 3, 2015
Sold by
Eastside Travel and Eastside Transp
Bought by
Alpha Alpha Inc
Current Estimated Value
Purchase Details
Closed on
Aug 20, 2009
Sold by
Fannie Mae
Bought by
Eastside Travel & Transport Llc
Purchase Details
Closed on
Feb 3, 2009
Sold by
Wachovia Mortgage Corporation
Bought by
Federal National Mortgage Association
Create a Home Valuation Report for This Property
The Home Valuation Report is an in-depth analysis detailing your home's value as well as a comparison with similar homes in the area
Home Values in the Area
Average Home Value in this Area
Purchase History
| Date | Buyer | Sale Price | Title Company |
|---|---|---|---|
| Alpha Alpha Inc | -- | -- | |
| Eastside Travel & Transport Llc | $11,500 | None Available | |
| Federal National Mortgage Association | -- | None Available | |
| Wachovia Mortgage Corporation | $65,072 | None Available |
Source: Public Records
Tax History Compared to Growth
Tax History
| Year | Tax Paid | Tax Assessment Tax Assessment Total Assessment is a certain percentage of the fair market value that is determined by local assessors to be the total taxable value of land and additions on the property. | Land | Improvement |
|---|---|---|---|---|
| 2025 | $626 | $15,984 | $4,456 | $11,528 |
| 2024 | $1,477 | $17,136 | $3,292 | $13,844 |
| 2023 | $675 | $17,136 | $3,292 | $13,844 |
| 2022 | $536 | $13,120 | $3,292 | $9,828 |
| 2021 | $543 | $13,244 | $3,292 | $9,952 |
| 2020 | $541 | $13,244 | $3,292 | $9,952 |
| 2019 | $543 | $13,244 | $3,292 | $9,952 |
| 2018 | $543 | $13,244 | $3,292 | $9,952 |
| 2017 | $2,331 | $13,244 | $3,292 | $9,952 |
| 2016 | $398 | $9,638 | $1,958 | $7,680 |
| 2015 | $159 | $9,638 | $1,958 | $7,680 |
| 2014 | $323 | $19,558 | $1,958 | $17,600 |
| 2013 | -- | $19,558 | $1,958 | $17,600 |
Source: Public Records
Map
Nearby Homes