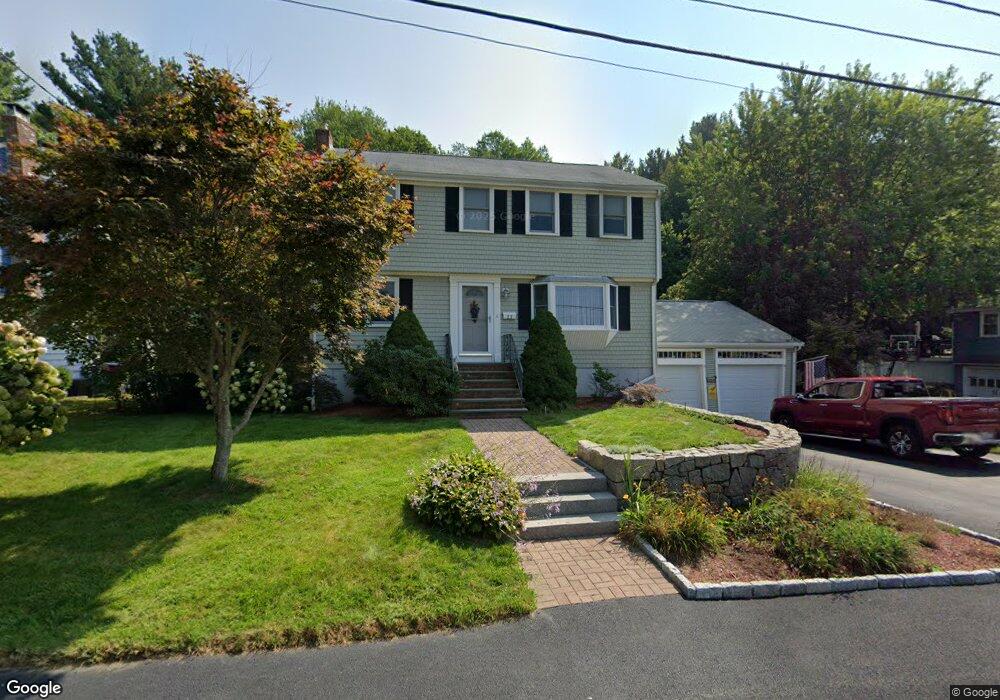
23 Mohawk Path Bellingham, MA 02019
Estimated Value: $536,767 - $620,000
4
Beds
2
Baths
1,567
Sq Ft
$375/Sq Ft
Est. Value
About This Home
This home is located at 23 Mohawk Path, Bellingham, MA 02019 and is currently estimated at $586,942, approximately $374 per square foot. 23 Mohawk Path is a home located in Norfolk County with nearby schools including Stall Brook Elementary School, Bellingham High School, and Bethany Christian Academy.
Ownership History
Date
Name
Owned For
Owner Type
Purchase Details
Closed on
May 14, 2024
Sold by
Power Deborah J and Power Walter S
Bought by
Power James C and Power Kara L
Current Estimated Value
Purchase Details
Closed on
Jan 12, 1979
Bought by
Power Walter S and Power Deborah J
Create a Home Valuation Report for This Property
The Home Valuation Report is an in-depth analysis detailing your home's value as well as a comparison with similar homes in the area
Home Values in the Area
Average Home Value in this Area
Purchase History
| Date | Buyer | Sale Price | Title Company |
|---|---|---|---|
| Power James C | -- | None Available | |
| Power James C | -- | None Available | |
| Power Walter S | $46,900 | -- |
Source: Public Records
Mortgage History
| Date | Status | Borrower | Loan Amount |
|---|---|---|---|
| Previous Owner | Power Walter S | $67,000 |
Source: Public Records
Tax History
| Year | Tax Paid | Tax Assessment Tax Assessment Total Assessment is a certain percentage of the fair market value that is determined by local assessors to be the total taxable value of land and additions on the property. | Land | Improvement |
|---|---|---|---|---|
| 2025 | $6,257 | $498,200 | $165,600 | $332,600 |
| 2024 | $5,599 | $435,400 | $151,200 | $284,200 |
| 2023 | $5,396 | $413,500 | $144,000 | $269,500 |
| 2022 | $5,276 | $374,700 | $120,100 | $254,600 |
| 2021 | $5,121 | $355,400 | $120,100 | $235,300 |
| 2020 | $4,786 | $336,600 | $120,100 | $216,500 |
| 2019 | $4,698 | $330,600 | $120,100 | $210,500 |
| 2018 | $4,412 | $306,200 | $115,500 | $190,700 |
| 2017 | $4,303 | $300,100 | $115,500 | $184,600 |
| 2016 | $4,120 | $288,300 | $113,500 | $174,800 |
| 2015 | $3,959 | $277,800 | $109,200 | $168,600 |
| 2014 | $3,988 | $272,000 | $106,600 | $165,400 |
Source: Public Records
Map
Nearby Homes
- 17 Pine St
- 44 Arapahoe Rd
- 60 Pine St
- 462 Hartford Ave
- 39 West St
- 10 Franklin St
- 276 Pond St
- 22 Granite St
- 6 Freedom Trail
- 8 Woodhaven Dr
- 15 Fox Run Rd
- 201 Crossfield Rd
- 214 Conlyn Ave
- 4 Shaw St
- 6 Kingson Ln Unit 2
- 2 Mechanic St Unit 1
- 176 Main St Unit 3
- 0 Hixon St Unit 73477486
- 8 Riverstone Way
- 38 Conlyn Ave
- 21 Mohawk Path
- 24 Mohawk Path
- 20 Mohawk Path
- 25 Mohawk Path
- 18 Mohawk Path
- 19 Mohawk Path
- 30 Mohawk Path
- 27 Mohawk Path
- 17 Mohawk Path
- 32 Mohawk Path
- 12 Mohawk Path
- 29 Mohawk Path
- 33 Mohawk Path
- 34 Mohawk Path
- 31 Mohawk Path
- 15 Mohawk Path
- 10 Sunken Meadow Rd
- 112 Plymouth Rd
- 35 Mohawk Path
- 36 Mohawk Path
Your Personal Tour Guide
Ask me questions while you tour the home.