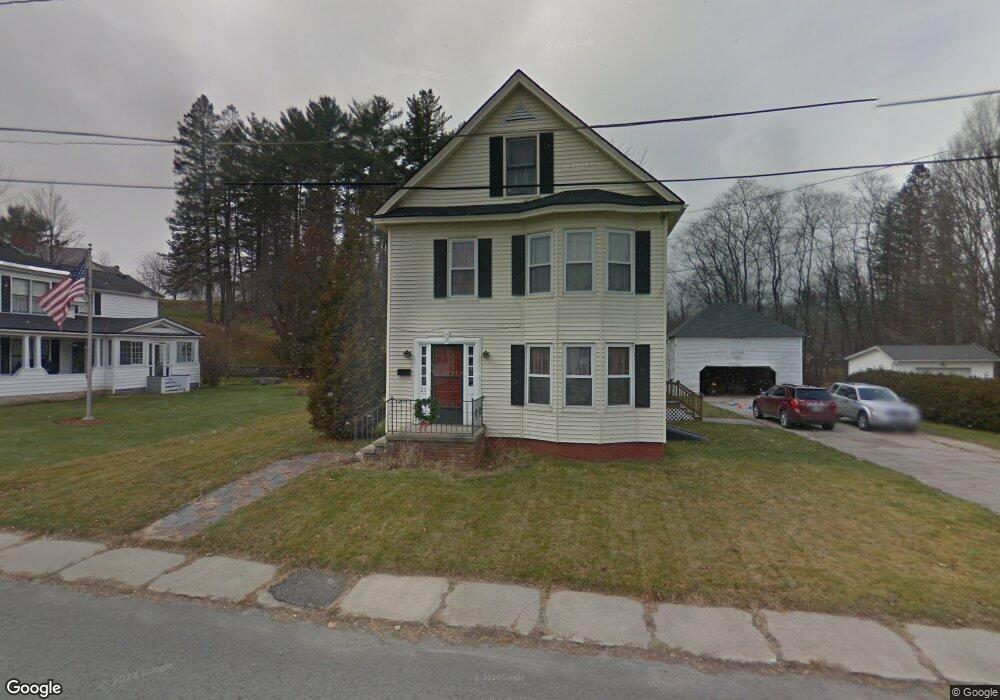
23 Monadnock St Colebrook, NH 03576
Estimated Value: $242,000 - $283,000
4
Beds
2
Baths
2,163
Sq Ft
$123/Sq Ft
Est. Value
About This Home
This home is located at 23 Monadnock St, Colebrook, NH 03576 and is currently estimated at $266,726, approximately $123 per square foot. 23 Monadnock St is a home located in Coos County with nearby schools including Colebrook Elementary School, Colebrook Academy, and Camp E-Toh-Anee.
Ownership History
Date
Name
Owned For
Owner Type
Purchase Details
Closed on
Jul 16, 2020
Sold by
Phinney Jordan C
Bought by
Phinney Jordan C and Nolette Andrew
Current Estimated Value
Purchase Details
Closed on
Sep 8, 2010
Sold by
Lambert James S and Lambert Selena M
Bought by
Phinney Jordan C
Home Financials for this Owner
Home Financials are based on the most recent Mortgage that was taken out on this home.
Original Mortgage
$140,849
Interest Rate
4.55%
Mortgage Type
Purchase Money Mortgage
Create a Home Valuation Report for This Property
The Home Valuation Report is an in-depth analysis detailing your home's value as well as a comparison with similar homes in the area
Home Values in the Area
Average Home Value in this Area
Purchase History
| Date | Buyer | Sale Price | Title Company |
|---|---|---|---|
| Phinney Jordan C | -- | None Available | |
| Phinney Jordan C | -- | None Available | |
| Phinney Jordan C | $145,000 | -- |
Source: Public Records
Mortgage History
| Date | Status | Borrower | Loan Amount |
|---|---|---|---|
| Previous Owner | Phinney Jordan C | $140,849 | |
| Previous Owner | Phinney Jordan C | $71,225 | |
| Previous Owner | Phinney Jordan C | $12,000 |
Source: Public Records
Tax History Compared to Growth
Tax History
| Year | Tax Paid | Tax Assessment Tax Assessment Total Assessment is a certain percentage of the fair market value that is determined by local assessors to be the total taxable value of land and additions on the property. | Land | Improvement |
|---|---|---|---|---|
| 2024 | $3,707 | $106,000 | $22,000 | $84,000 |
| 2023 | $3,356 | $106,000 | $22,000 | $84,000 |
| 2022 | $2,991 | $105,600 | $22,000 | $83,600 |
| 2021 | $3,096 | $105,600 | $22,000 | $83,600 |
| 2020 | $2,934 | $105,600 | $22,000 | $83,600 |
| 2019 | $3,182 | $105,600 | $22,000 | $83,600 |
| 2018 | $3,778 | $125,400 | $22,000 | $103,400 |
| 2017 | $3,698 | $125,400 | $22,000 | $103,400 |
| 2016 | $3,575 | $125,400 | $22,000 | $103,400 |
| 2015 | $3,623 | $125,400 | $22,000 | $103,400 |
| 2014 | $3,630 | $125,400 | $22,000 | $103,400 |
| 2013 | $3,244 | $140,600 | $30,000 | $110,600 |
Source: Public Records
Map
Nearby Homes