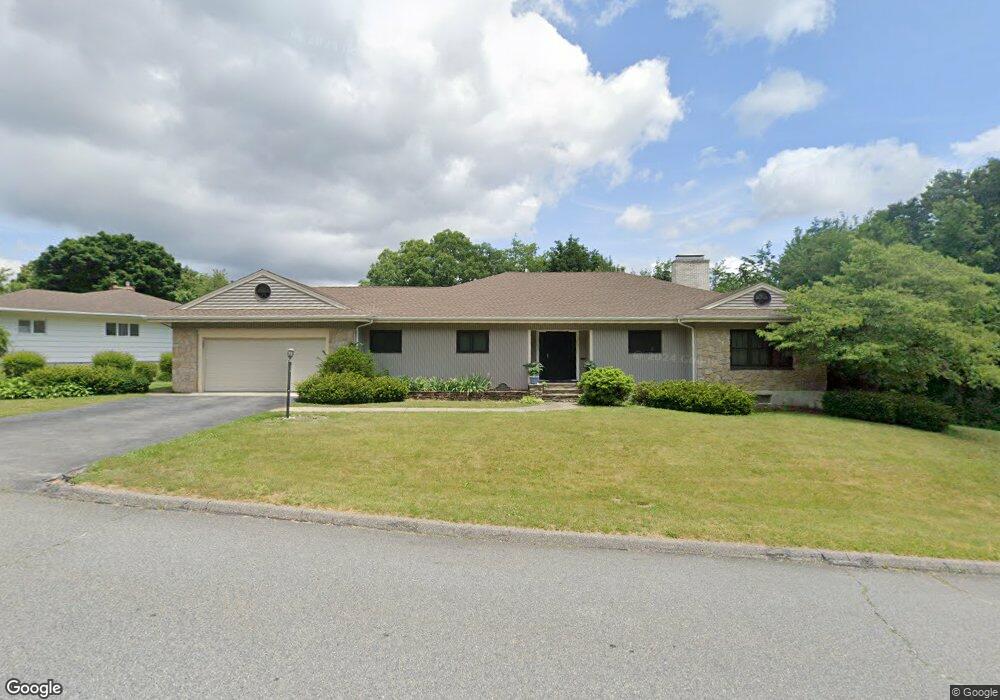
23 Montclair Dr Worcester, MA 01609
Forest Grove NeighborhoodEstimated Value: $714,000 - $801,000
3
Beds
3
Baths
2,600
Sq Ft
$287/Sq Ft
Est. Value
About This Home
This home is located at 23 Montclair Dr, Worcester, MA 01609 and is currently estimated at $746,421, approximately $287 per square foot. 23 Montclair Dr is a home located in Worcester County with nearby schools including Nelson Place Elementary School, Jacob Hiatt Magnet School, and Chandler Magnet.
Ownership History
Date
Name
Owned For
Owner Type
Purchase Details
Closed on
Jul 28, 1997
Sold by
Grenier Robert L and Grenier Bonnie
Bought by
Sherfey Jay W and Aikens Claudia
Current Estimated Value
Purchase Details
Closed on
Mar 29, 1994
Sold by
Peter Consiglio Sr Tr and Noonan Richard
Bought by
Grenier Robert and Grenier Bonnie
Purchase Details
Closed on
May 1, 1992
Sold by
Parker Rlty Corp
Bought by
P Consiglio Sr Trust 1
Create a Home Valuation Report for This Property
The Home Valuation Report is an in-depth analysis detailing your home's value as well as a comparison with similar homes in the area
Home Values in the Area
Average Home Value in this Area
Purchase History
| Date | Buyer | Sale Price | Title Company |
|---|---|---|---|
| Sherfey Jay W | $250,000 | -- | |
| Grenier Robert | $205,000 | -- | |
| P Consiglio Sr Trust 1 | $245,000 | -- |
Source: Public Records
Mortgage History
| Date | Status | Borrower | Loan Amount |
|---|---|---|---|
| Open | P Consiglio Sr Trust 1 | $244,000 | |
| Closed | P Consiglio Sr Trust 1 | $20,000 |
Source: Public Records
Tax History
| Year | Tax Paid | Tax Assessment Tax Assessment Total Assessment is a certain percentage of the fair market value that is determined by local assessors to be the total taxable value of land and additions on the property. | Land | Improvement |
|---|---|---|---|---|
| 2025 | $8,890 | $674,000 | $124,200 | $549,800 |
| 2024 | $8,598 | $625,300 | $124,200 | $501,100 |
| 2023 | $8,409 | $586,400 | $106,900 | $479,500 |
| 2022 | $7,687 | $505,400 | $85,500 | $419,900 |
| 2021 | $7,756 | $476,400 | $68,400 | $408,000 |
| 2020 | $7,587 | $446,300 | $68,200 | $378,100 |
| 2019 | $7,511 | $417,300 | $66,000 | $351,300 |
| 2018 | $7,180 | $379,700 | $66,000 | $313,700 |
| 2017 | $7,628 | $396,900 | $66,000 | $330,900 |
| 2016 | $7,920 | $384,300 | $55,700 | $328,600 |
| 2015 | $7,713 | $384,300 | $55,700 | $328,600 |
| 2014 | $7,527 | $385,200 | $55,700 | $329,500 |
Source: Public Records
Map
Nearby Homes
Your Personal Tour Guide
Ask me questions while you tour the home.