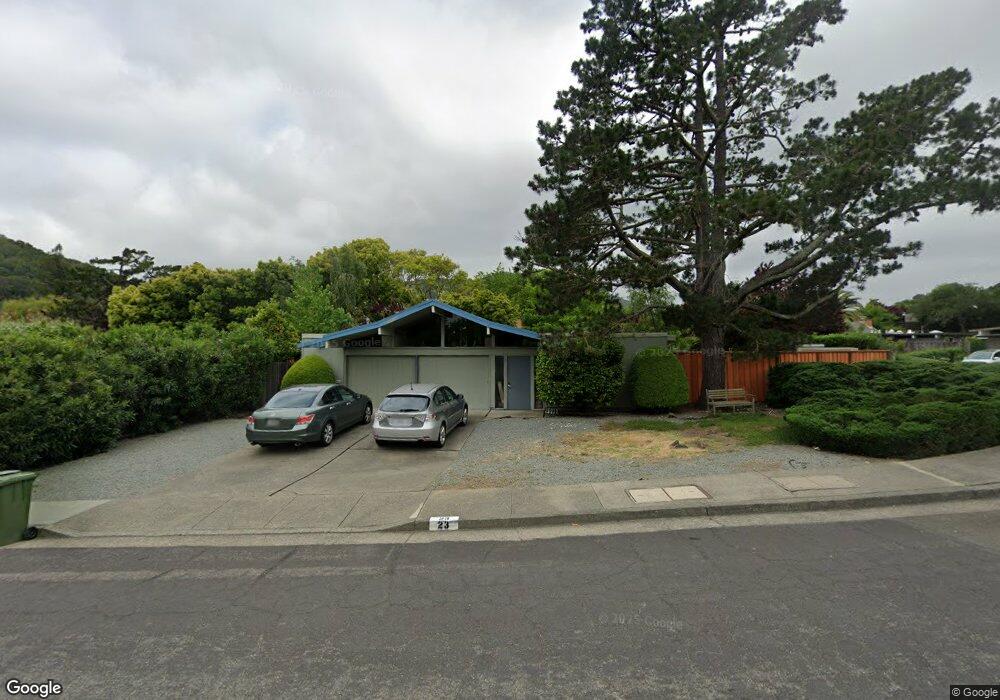
23 Mount Lassen Dr San Rafael, CA 94903
Lucas Valley NeighborhoodEstimated Value: $1,242,828 - $1,988,000
3
Beds
2
Baths
1,560
Sq Ft
$1,035/Sq Ft
Est. Value
About This Home
This home is located at 23 Mount Lassen Dr, San Rafael, CA 94903 and is currently estimated at $1,613,957, approximately $1,034 per square foot. 23 Mount Lassen Dr is a home located in Marin County with nearby schools including Lucas Valley Elementary School, Miller Creek Middle School, and Terra Linda High School.
Ownership History
Date
Name
Owned For
Owner Type
Purchase Details
Closed on
Oct 7, 2013
Sold by
Buchheit Carl L and Buchheit Barbara R
Bought by
Buchheit Carl L
Current Estimated Value
Purchase Details
Closed on
Feb 13, 2000
Sold by
Murphy Edward E
Bought by
Murphy Edward Ernst
Home Financials for this Owner
Home Financials are based on the most recent Mortgage that was taken out on this home.
Original Mortgage
$325,000
Outstanding Balance
$107,279
Interest Rate
8.14%
Estimated Equity
$1,506,678
Purchase Details
Closed on
Feb 8, 2000
Sold by
Murphy Edward E
Bought by
Buchheit Carl L and Buchheit Barbara R
Home Financials for this Owner
Home Financials are based on the most recent Mortgage that was taken out on this home.
Original Mortgage
$325,000
Outstanding Balance
$107,279
Interest Rate
8.14%
Estimated Equity
$1,506,678
Create a Home Valuation Report for This Property
The Home Valuation Report is an in-depth analysis detailing your home's value as well as a comparison with similar homes in the area
Home Values in the Area
Average Home Value in this Area
Purchase History
| Date | Buyer | Sale Price | Title Company |
|---|---|---|---|
| Buchheit Carl L | -- | None Available | |
| Buchheit Carl L | -- | None Available | |
| Murphy Edward Ernst | -- | First American Title Co | |
| Buchheit Carl L | $425,000 | First American Title Co | |
| Murphy Edward E | -- | First American Title Co |
Source: Public Records
Mortgage History
| Date | Status | Borrower | Loan Amount |
|---|---|---|---|
| Open | Buchheit Carl L | $325,000 |
Source: Public Records
Tax History Compared to Growth
Tax History
| Year | Tax Paid | Tax Assessment Tax Assessment Total Assessment is a certain percentage of the fair market value that is determined by local assessors to be the total taxable value of land and additions on the property. | Land | Improvement |
|---|---|---|---|---|
| 2025 | $10,092 | $657,693 | $378,963 | $278,730 |
| 2024 | $10,092 | $644,799 | $371,534 | $273,265 |
| 2023 | $9,980 | $632,157 | $364,250 | $267,907 |
| 2022 | $9,570 | $619,764 | $357,109 | $262,655 |
| 2021 | $9,134 | $607,616 | $350,109 | $257,507 |
| 2020 | $9,081 | $601,389 | $346,521 | $254,868 |
| 2019 | $8,726 | $589,599 | $339,728 | $249,871 |
| 2018 | $8,609 | $578,039 | $333,067 | $244,972 |
| 2017 | $8,105 | $566,708 | $326,538 | $240,170 |
| 2016 | $7,929 | $555,599 | $320,137 | $235,462 |
| 2015 | $7,706 | $547,254 | $315,328 | $231,926 |
| 2014 | $7,208 | $536,534 | $309,152 | $227,382 |
Source: Public Records
Map
Nearby Homes
- 19 Mount Lassen Dr
- 12 Mount Susitna Ct
- 51 Mount Muir Ct
- 316 Mount Shasta Dr
- 100 Mount Lyell Dr
- 936 Patricia Way
- 29 Mount Foraker Dr
- 100 De la Guerra Rd
- 16 Diego Dr
- 92 Upper Oak Dr
- 642 Appleberry Dr
- 11 Oak Tree Ct
- 562 Kernberry Dr
- 1081 Las Raposas Rd
- 659 Las Colindas Rd
- 467 Cedar Hill Dr
- 876 Las Ovejas Ave
- 38 Twelveoak Hill Dr
- 8 Clover Hill Ct
- 711 Montecillo Rd
- 21 Mount Lassen Dr
- 1111 Idylberry Rd
- 1100 Idylberry Rd
- 1110 Idylberry Rd
- 1115 Idylberry Rd
- 1118 Idylberry Rd
- 17 Mount Lassen Dr
- 14 Mount Darwin Ct
- 1098 Idylberry Rd
- 25 Mount Lassen Dr
- 1117 Idylberry Rd
- 1122 Idylberry Rd
- 10 Mount Darwin Ct
- 16 Mount Diablo Cir
- 14 Mount Diablo Cir
- 31 Mt Lassen Drive 415-385-5104
- 6 Mount Darwin Ct
- 2 Mount Darwin Ct
- 18 Mount Diablo Cir
- 31 Mount Lassen Dr