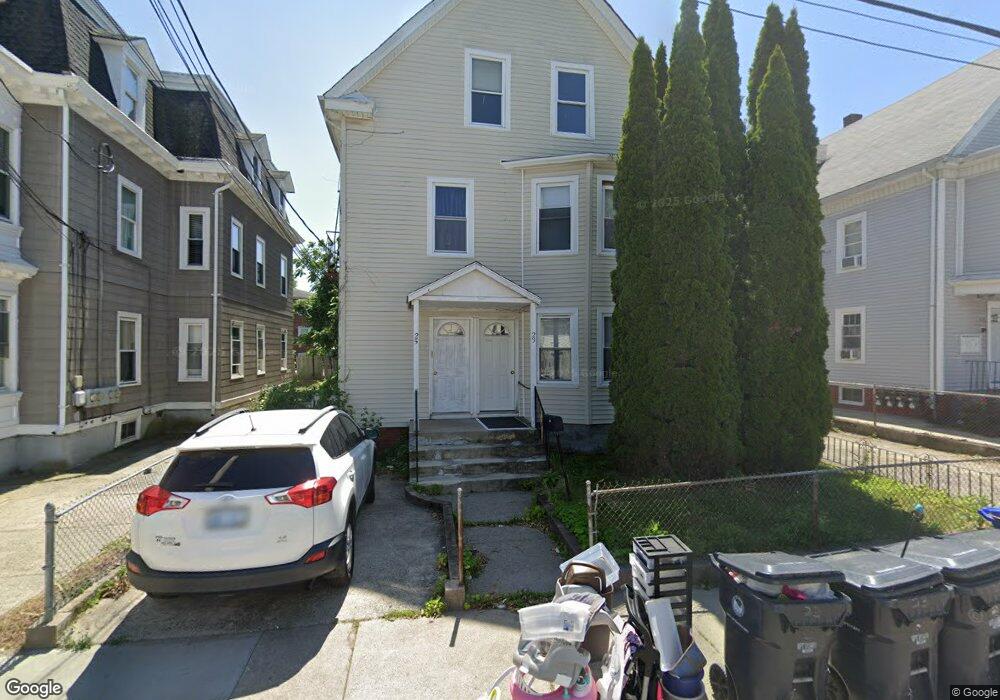
23 Myrtle St Pawtucket, RI 02860
Pleasant View NeighborhoodEstimated Value: $344,775 - $703,000
9
Beds
3
Baths
3,529
Sq Ft
$164/Sq Ft
Est. Value
About This Home
This home is located at 23 Myrtle St, Pawtucket, RI 02860 and is currently estimated at $580,194, approximately $164 per square foot. 23 Myrtle St is a home located in Providence County with nearby schools including St Cecilia School and Saint Raphael Academy.
Ownership History
Date
Name
Owned For
Owner Type
Purchase Details
Closed on
Nov 25, 2009
Sold by
373 North Main Street
Bought by
Danmola Olajide B
Current Estimated Value
Home Financials for this Owner
Home Financials are based on the most recent Mortgage that was taken out on this home.
Original Mortgage
$139,300
Interest Rate
4.92%
Mortgage Type
Purchase Money Mortgage
Purchase Details
Closed on
Nov 5, 2009
Sold by
National City Bk
Bought by
273 N Main Street Llc
Home Financials for this Owner
Home Financials are based on the most recent Mortgage that was taken out on this home.
Original Mortgage
$139,300
Interest Rate
4.92%
Mortgage Type
Purchase Money Mortgage
Purchase Details
Closed on
Jul 13, 2009
Sold by
Victorino Oscar A
Bought by
National City Bank
Create a Home Valuation Report for This Property
The Home Valuation Report is an in-depth analysis detailing your home's value as well as a comparison with similar homes in the area
Home Values in the Area
Average Home Value in this Area
Purchase History
| Date | Buyer | Sale Price | Title Company |
|---|---|---|---|
| Danmola Olajide B | $145,000 | -- | |
| 273 N Main Street Llc | $120,000 | -- | |
| National City Bank | $121,500 | -- |
Source: Public Records
Mortgage History
| Date | Status | Borrower | Loan Amount |
|---|---|---|---|
| Open | National City Bank | $150,386 | |
| Closed | National City Bank | $139,300 | |
| Previous Owner | National City Bank | $324,500 |
Source: Public Records
Tax History
| Year | Tax Paid | Tax Assessment Tax Assessment Total Assessment is a certain percentage of the fair market value that is determined by local assessors to be the total taxable value of land and additions on the property. | Land | Improvement |
|---|---|---|---|---|
| 2025 | $6,466 | $491,700 | $104,700 | $387,000 |
| 2024 | $6,068 | $491,700 | $104,700 | $387,000 |
| 2023 | $5,888 | $347,600 | $60,700 | $286,900 |
| 2022 | $5,763 | $347,600 | $60,700 | $286,900 |
| 2021 | $5,763 | $347,600 | $60,700 | $286,900 |
| 2020 | $4,619 | $221,100 | $50,600 | $170,500 |
| 2019 | $4,619 | $221,100 | $50,600 | $170,500 |
| 2018 | $4,451 | $221,100 | $50,600 | $170,500 |
| 2017 | $4,344 | $191,200 | $41,000 | $150,200 |
| 2016 | $4,185 | $191,200 | $41,000 | $150,200 |
| 2015 | $4,185 | $191,200 | $41,000 | $150,200 |
| 2014 | $3,302 | $143,200 | $41,000 | $102,200 |
Source: Public Records
Map
Nearby Homes
- 133 Cottage St
- 48 Kossuth St
- 150 N Bend St
- 19 Wood St
- 89 Armistice Blvd
- 176 Central Ave
- 23 Spring St
- 35 Laurel St
- 36 Underwood St
- 54 Sabin St
- 211 Carnation St
- 10 Exchange Ct Unit 203
- 300 Front St Unit 409
- 396 Roosevelt Ave
- 65 Johnson St Unit C
- 146 S Bend St
- 256 High St
- 511 High St
- 517 High St
- 39 Webster St Unit 204
Your Personal Tour Guide
Ask me questions while you tour the home.