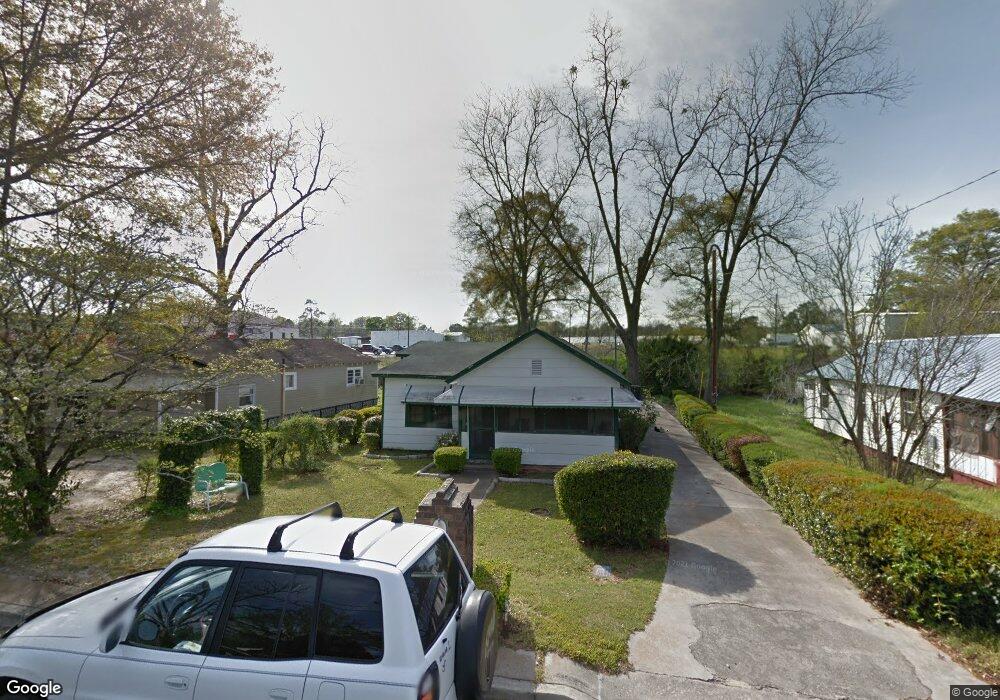
23 N Second Ave Mc Rae, GA 31055
Estimated Value: $70,564 - $131,000
Studio
2
Baths
1,188
Sq Ft
$82/Sq Ft
Est. Value
About This Home
This home is located at 23 N Second Ave, Mc Rae, GA 31055 and is currently estimated at $97,855, approximately $82 per square foot. 23 N Second Ave is a home located in Telfair County with nearby schools including Telfair County Elementary School, Telfair County Middle School, and Telfair County High School.
Ownership History
Date
Name
Owned For
Owner Type
Purchase Details
Closed on
May 13, 2020
Sold by
The Merchants & Citizens Bank
Bought by
Green Mickey Don
Current Estimated Value
Purchase Details
Closed on
Oct 1, 2019
Sold by
Randolph Victoria P
Bought by
The Merchants & Citizens Bank
Purchase Details
Closed on
Jul 31, 2019
Sold by
Padgett Brenda
Bought by
Spires Padgett Brenda C
Purchase Details
Closed on
Oct 6, 2005
Sold by
Merritt Brenda P
Bought by
Randolph Victoria P
Home Financials for this Owner
Home Financials are based on the most recent Mortgage that was taken out on this home.
Original Mortgage
$10,595
Interest Rate
5.66%
Mortgage Type
New Conventional
Purchase Details
Closed on
Jul 3, 2004
Sold by
Tyson Jacqueline W
Bought by
Merritt Brenda
Purchase Details
Closed on
Jun 2, 1998
Sold by
Williams Robert B
Bought by
Tyson Jacqueline W
Create a Home Valuation Report for This Property
The Home Valuation Report is an in-depth analysis detailing your home's value as well as a comparison with similar homes in the area
Home Values in the Area
Average Home Value in this Area
Purchase History
| Date | Buyer | Sale Price | Title Company |
|---|---|---|---|
| Green Mickey Don | $3,000 | -- | |
| The Merchants & Citizens Bank | -- | -- | |
| Spires Padgett Brenda C | -- | -- | |
| Randolph Victoria P | $5,500 | -- | |
| Merritt Brenda | -- | -- | |
| Tyson Jacqueline W | -- | -- |
Source: Public Records
Mortgage History
| Date | Status | Borrower | Loan Amount |
|---|---|---|---|
| Previous Owner | Randolph Victoria P | $10,595 |
Source: Public Records
Tax History
| Year | Tax Paid | Tax Assessment Tax Assessment Total Assessment is a certain percentage of the fair market value that is determined by local assessors to be the total taxable value of land and additions on the property. | Land | Improvement |
|---|---|---|---|---|
| 2025 | $637 | $16,123 | $980 | $15,143 |
| 2024 | $596 | $14,777 | $980 | $13,797 |
| 2023 | $675 | $16,672 | $980 | $15,692 |
| 2022 | $496 | $16,672 | $980 | $15,692 |
| 2021 | $38 | $11,500 | $980 | $10,520 |
| 2020 | $355 | $11,156 | $980 | $10,176 |
| 2019 | $357 | $11,156 | $980 | $10,176 |
| 2018 | $489 | $11,348 | $980 | $10,368 |
| 2017 | $365 | $11,462 | $1,882 | $9,580 |
| 2016 | $365 | $11,462 | $1,882 | $9,580 |
| 2015 | -- | $11,462 | $1,882 | $9,580 |
| 2014 | -- | $12,080 | $1,960 | $10,120 |
| 2013 | -- | $12,080 | $1,960 | $10,120 |
Source: Public Records
Map
Nearby Homes
- 427 3rd Ave
- 11 Zanders Ave
- 0 Center Ave Unit 10648464
- 0 Center Ave Unit 23896
- 47 S First Ave
- 0 Ll350 & 398 7th District Unit 30490
- 76 E Grant St
- 131 Huckabee St
- 78 S Second Ave
- 39 13th St
- 13 Studstill Ln
- 210 W Graham St
- 136 S Third Ave
- 61 W Bruce St
- 27 E Bruce St
- 0 Bonaire St Unit 10647239
- 0 Bonaire St Unit 23852
- 177 W Brewton St
- 3 E Ninth St
- 85 E Brewton St
- 25 N Second Ave
- 27 N Second Ave
- 24 N Second Ave
- 26 N Second Ave
- 28 N Second Ave
- 8 W Grant St
- 311 S Second Ave
- 6 W Grant St
- 37 N Second Ave
- 12 W Magnolia St
- 33 N Second Ave
- 34 N Second Ave
- 33 N First Ave
- 300 N First Ave
- 308 N First Ave
- 31 S 1st Ave
- 31 S First Ave
- 310 N First Ave
- 317 S Second Ave
- 9 W Magnolia St
Your Personal Tour Guide
Ask me questions while you tour the home.