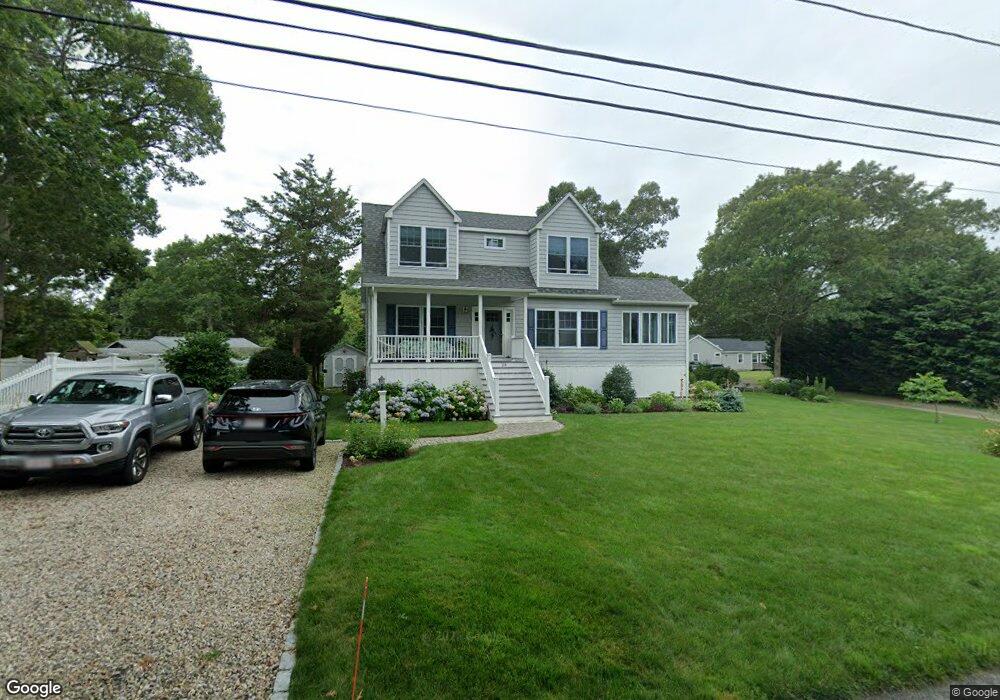
23 N Shore Rd Pocasset, MA 02559
Pocasset NeighborhoodEstimated Value: $740,000 - $1,123,638
3
Beds
1
Bath
800
Sq Ft
$1,197/Sq Ft
Est. Value
About This Home
This home is located at 23 N Shore Rd, Pocasset, MA 02559 and is currently estimated at $957,410, approximately $1,196 per square foot. 23 N Shore Rd is a home located in Barnstable County with nearby schools including Bourne High School and Cadence Academy Preschool - Bourne.
Ownership History
Date
Name
Owned For
Owner Type
Purchase Details
Closed on
Nov 4, 2021
Sold by
Lechak Janice O and Lechak Edward J
Bought by
Lechak Family Irt 2021 and Lechak
Current Estimated Value
Purchase Details
Closed on
Jun 22, 2016
Sold by
Palioca Ross K and Palioca Lisa M
Bought by
Lechak Edward J and Lechak Janice O
Purchase Details
Closed on
Aug 5, 1996
Sold by
Wilson William S
Bought by
Palioca Ross K and Palioca Lisa M
Create a Home Valuation Report for This Property
The Home Valuation Report is an in-depth analysis detailing your home's value as well as a comparison with similar homes in the area
Home Values in the Area
Average Home Value in this Area
Purchase History
| Date | Buyer | Sale Price | Title Company |
|---|---|---|---|
| Lechak Family Irt 2021 | -- | None Available | |
| Lechak Family Irt 2021 | -- | None Available | |
| Lechak Edward J | $275,000 | -- | |
| Lechak Edward J | $275,000 | -- | |
| Palioca Ross K | $124,900 | -- | |
| Palioca Ross K | $124,900 | -- |
Source: Public Records
Tax History Compared to Growth
Tax History
| Year | Tax Paid | Tax Assessment Tax Assessment Total Assessment is a certain percentage of the fair market value that is determined by local assessors to be the total taxable value of land and additions on the property. | Land | Improvement |
|---|---|---|---|---|
| 2025 | $7,166 | $917,600 | $444,500 | $473,100 |
| 2024 | $7,008 | $873,800 | $423,300 | $450,500 |
| 2023 | $6,416 | $728,300 | $329,700 | $398,600 |
| 2022 | $5,584 | $553,400 | $258,600 | $294,800 |
| 2021 | $3,092 | $287,100 | $235,300 | $51,800 |
| 2020 | $3,033 | $282,400 | $233,100 | $49,300 |
| 2019 | $2,939 | $279,600 | $233,100 | $46,500 |
| 2018 | $2,867 | $272,000 | $227,700 | $44,300 |
| 2017 | $3,008 | $292,000 | $248,100 | $43,900 |
| 2016 | $3,044 | $299,600 | $225,600 | $74,000 |
| 2015 | $3,017 | $299,600 | $225,600 | $74,000 |
Source: Public Records
Map
Nearby Homes