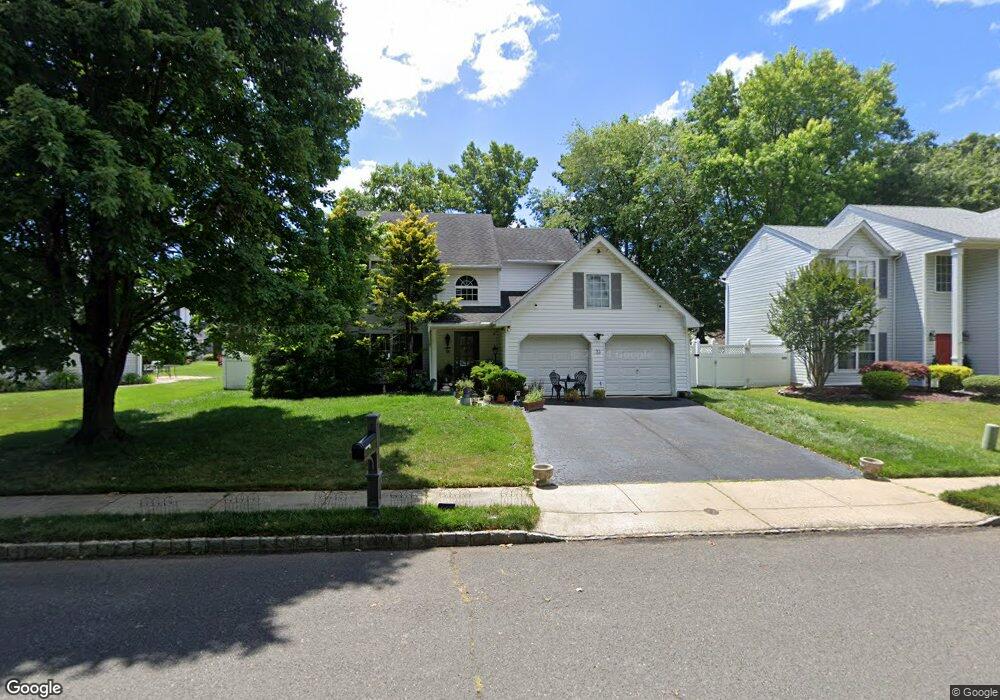
23 Nutmeg Rd Matawan, NJ 07747
Estimated Value: $691,000 - $831,000
3
Beds
2
Baths
1,883
Sq Ft
$402/Sq Ft
Est. Value
About This Home
This home is located at 23 Nutmeg Rd, Matawan, NJ 07747 and is currently estimated at $756,465, approximately $401 per square foot. 23 Nutmeg Rd is a home located in Monmouth County with nearby schools including Matawan Reg High School, St. Joseph Elementary School, and Icob Academy.
Ownership History
Date
Name
Owned For
Owner Type
Purchase Details
Closed on
Jul 27, 2001
Sold by
Himelfarb Jeffrey
Bought by
Hemenway James
Current Estimated Value
Home Financials for this Owner
Home Financials are based on the most recent Mortgage that was taken out on this home.
Original Mortgage
$256,500
Outstanding Balance
$99,695
Interest Rate
7.1%
Estimated Equity
$656,770
Purchase Details
Closed on
Apr 30, 1997
Sold by
Ahb At Aberdeen
Bought by
Himelfarb Jeffrey and Campanella Jodi
Home Financials for this Owner
Home Financials are based on the most recent Mortgage that was taken out on this home.
Original Mortgage
$126,000
Interest Rate
7.88%
Purchase Details
Closed on
Aug 11, 1990
Sold by
Hemenway James
Bought by
Mojica Vladimir and Mojica Patricia
Home Financials for this Owner
Home Financials are based on the most recent Mortgage that was taken out on this home.
Original Mortgage
$249,000
Interest Rate
10.04%
Create a Home Valuation Report for This Property
The Home Valuation Report is an in-depth analysis detailing your home's value as well as a comparison with similar homes in the area
Home Values in the Area
Average Home Value in this Area
Purchase History
| Date | Buyer | Sale Price | Title Company |
|---|---|---|---|
| Hemenway James | $322,000 | -- | |
| Himelfarb Jeffrey | $175,900 | -- | |
| Mojica Vladimir | $339,900 | -- |
Source: Public Records
Mortgage History
| Date | Status | Borrower | Loan Amount |
|---|---|---|---|
| Open | Hemenway James | $256,500 | |
| Previous Owner | Himelfarb Jeffrey | $126,000 | |
| Previous Owner | Mojica Vladimir | $249,000 |
Source: Public Records
Tax History
| Year | Tax Paid | Tax Assessment Tax Assessment Total Assessment is a certain percentage of the fair market value that is determined by local assessors to be the total taxable value of land and additions on the property. | Land | Improvement |
|---|---|---|---|---|
| 2025 | $12,813 | $670,100 | $407,400 | $262,700 |
| 2024 | $13,262 | $634,000 | $376,900 | $257,100 |
| 2023 | $13,262 | $620,000 | $369,200 | $250,800 |
| 2022 | $12,499 | $457,100 | $161,900 | $295,200 |
| 2021 | $12,499 | $462,400 | $199,800 | $262,600 |
| 2020 | $12,172 | $448,500 | $191,800 | $256,700 |
| 2019 | $12,461 | $446,000 | $190,800 | $255,200 |
| 2018 | $11,931 | $428,100 | $184,800 | $243,300 |
| 2017 | $11,212 | $408,000 | $194,800 | $213,200 |
| 2016 | $10,482 | $398,100 | $187,800 | $210,300 |
| 2015 | $10,198 | $371,800 | $147,800 | $224,000 |
| 2014 | $10,768 | $400,300 | $177,800 | $222,500 |
Source: Public Records
Map
Nearby Homes
- 3 Noble Place
- 13 Cresci Blvd
- 11 Anton Place
- 3 Harrison Ave
- 55 Lower Main St
- 49 Lucia Ct
- 207 Lower Main St
- 154 Lower Main St
- 46 Parkview Dr
- 10 Johnson Ave
- 16 Galway Dr
- 5 Barrier Dr
- 20 Galway Dr
- 284 Washington St
- 68 Main St
- 9 Parkview Dr
- 81 Village Green Way
- 5 Limerick Place
- 173 Village Green Way
- 52 Highway 35
Your Personal Tour Guide
Ask me questions while you tour the home.