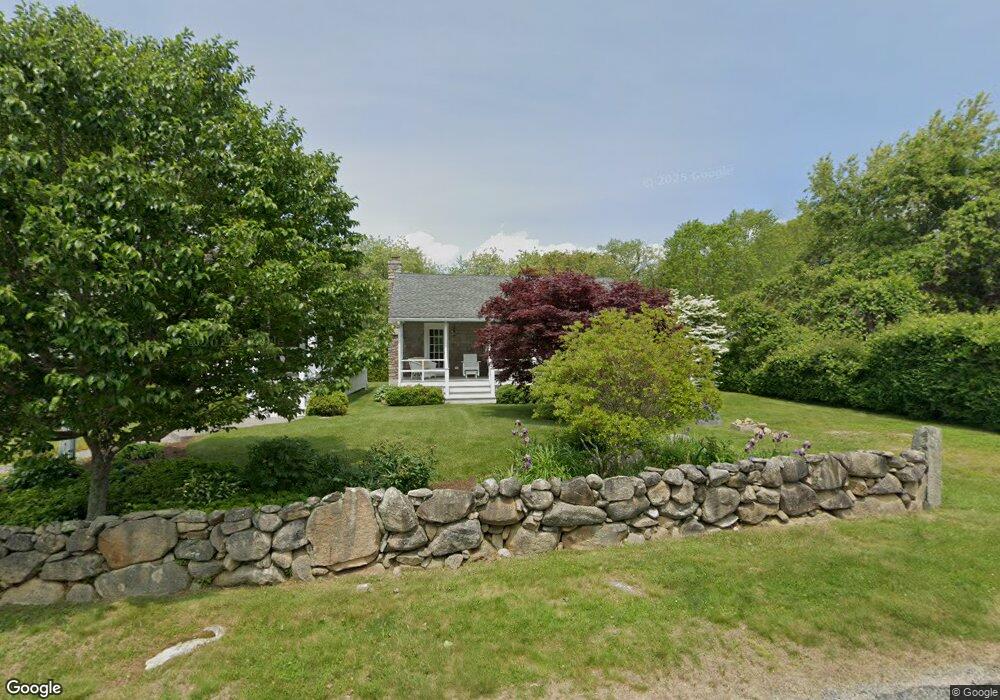
23 Old West Beach Rd Charlestown, RI 02813
Estimated Value: $1,546,000 - $2,314,000
--
Bed
--
Bath
--
Sq Ft
0.41
Acres
About This Home
This home is located at 23 Old West Beach Rd, Charlestown, RI 02813 and is currently estimated at $2,017,882. 23 Old West Beach Rd is a home with nearby schools including Chariho Regional Middle School and Chariho High School.
Ownership History
Date
Name
Owned For
Owner Type
Purchase Details
Closed on
Nov 19, 2019
Sold by
Hoff Stephen W and Hoff Sandwell
Bought by
Stephen Warren Hoff Ret
Current Estimated Value
Purchase Details
Closed on
Mar 21, 2008
Sold by
Sandwell Peter G
Bought by
Hoff Stephen W and Hoff Margaret S
Purchase Details
Closed on
Apr 3, 2007
Sold by
Wahl Jane S
Bought by
Hoff Stephen W and Hoff Margaret S
Create a Home Valuation Report for This Property
The Home Valuation Report is an in-depth analysis detailing your home's value as well as a comparison with similar homes in the area
Home Values in the Area
Average Home Value in this Area
Purchase History
| Date | Buyer | Sale Price | Title Company |
|---|---|---|---|
| Stephen Warren Hoff Ret | -- | -- | |
| Hoff Stephen W | $130,000 | -- | |
| Hoff Stephen W | $119,500 | -- | |
| Hoff Stephen W | $119,500 | -- | |
| Hoff Stephen W | $119,500 | -- |
Source: Public Records
Mortgage History
| Date | Status | Borrower | Loan Amount |
|---|---|---|---|
| Previous Owner | Hoff Stephen W | $205,000 | |
| Previous Owner | Hoff Stephen W | $30,000 | |
| Previous Owner | Hoff Stephen W | $175,000 |
Source: Public Records
Tax History Compared to Growth
Tax History
| Year | Tax Paid | Tax Assessment Tax Assessment Total Assessment is a certain percentage of the fair market value that is determined by local assessors to be the total taxable value of land and additions on the property. | Land | Improvement |
|---|---|---|---|---|
| 2025 | $8,495 | $1,432,500 | $928,400 | $504,100 |
| 2024 | $8,280 | $1,432,500 | $928,400 | $504,100 |
| 2023 | $8,223 | $1,432,500 | $928,400 | $504,100 |
| 2022 | $7,281 | $891,200 | $537,000 | $354,200 |
| 2021 | $7,290 | $891,200 | $537,000 | $354,200 |
| 2020 | $7,335 | $891,200 | $537,000 | $354,200 |
| 2019 | $7,478 | $810,200 | $537,000 | $273,200 |
| 2018 | $7,810 | $810,200 | $537,000 | $273,200 |
| 2017 | $7,755 | $808,700 | $535,500 | $273,200 |
| 2016 | $8,082 | $791,600 | $508,000 | $283,600 |
| 2015 | $8,003 | $791,600 | $508,000 | $283,600 |
| 2014 | $7,837 | $791,600 | $508,000 | $283,600 |
Source: Public Records
Map
Nearby Homes