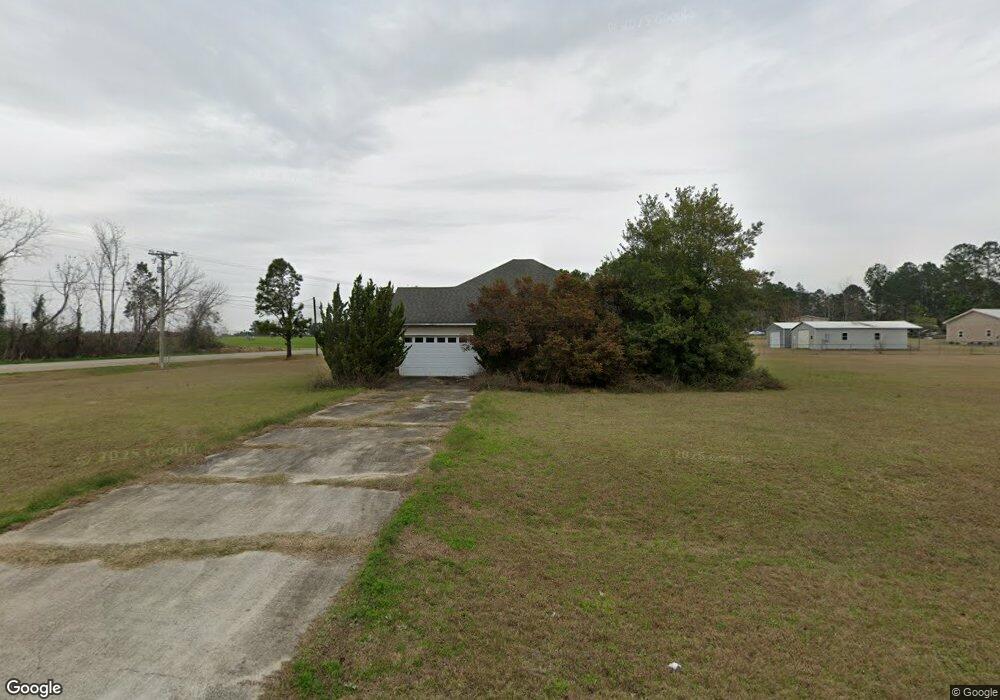
23 Orchard Way Quitman, GA 31643
Estimated Value: $236,701 - $336,000
3
Beds
2
Baths
1,591
Sq Ft
$179/Sq Ft
Est. Value
About This Home
This home is located at 23 Orchard Way, Quitman, GA 31643 and is currently estimated at $285,425, approximately $179 per square foot. 23 Orchard Way is a home located in Brooks County with nearby schools including North Brooks Elementary School.
Ownership History
Date
Name
Owned For
Owner Type
Purchase Details
Closed on
Apr 21, 2009
Sold by
Southern Signature Homes Llc
Bought by
Postell Jeanetta Delorise
Current Estimated Value
Home Financials for this Owner
Home Financials are based on the most recent Mortgage that was taken out on this home.
Original Mortgage
$134,400
Outstanding Balance
$92,836
Interest Rate
4.86%
Mortgage Type
USDA
Estimated Equity
$192,589
Purchase Details
Closed on
Apr 29, 2008
Bought by
Restrictive Covenant
Purchase Details
Closed on
Jul 3, 2007
Sold by
Dixie Land Investments Llc
Bought by
Southern Signature Homes Llc
Purchase Details
Closed on
Aug 9, 2006
Sold by
Jones David
Bought by
Dixie Land Investments Llc
Purchase Details
Closed on
May 7, 2004
Sold by
Youmans Gloria
Bought by
Jones David Etal
Purchase Details
Closed on
Sep 15, 2003
Sold by
Youmans Charles L
Bought by
Youmans Gloria
Purchase Details
Closed on
Dec 26, 1996
Bought by
Youmans Charles L
Create a Home Valuation Report for This Property
The Home Valuation Report is an in-depth analysis detailing your home's value as well as a comparison with similar homes in the area
Home Values in the Area
Average Home Value in this Area
Purchase History
| Date | Buyer | Sale Price | Title Company |
|---|---|---|---|
| Postell Jeanetta Delorise | $134,400 | -- | |
| Restrictive Covenant | -- | -- | |
| Southern Signature Homes Llc | $196,700 | -- | |
| Dixie Land Investments Llc | $161,000 | -- | |
| Jones David Etal | $88,000 | -- | |
| Youmans Gloria | -- | -- | |
| Youmans Charles L | -- | -- |
Source: Public Records
Mortgage History
| Date | Status | Borrower | Loan Amount |
|---|---|---|---|
| Open | Postell Jeanetta Delorise | $134,400 |
Source: Public Records
Tax History Compared to Growth
Tax History
| Year | Tax Paid | Tax Assessment Tax Assessment Total Assessment is a certain percentage of the fair market value that is determined by local assessors to be the total taxable value of land and additions on the property. | Land | Improvement |
|---|---|---|---|---|
| 2024 | $2,391 | $78,680 | $11,320 | $67,360 |
| 2023 | $2,594 | $79,000 | $11,320 | $67,680 |
| 2022 | $2,130 | $76,680 | $13,600 | $63,080 |
| 2021 | $1,773 | $63,840 | $11,200 | $52,640 |
| 2020 | $1,763 | $63,480 | $10,640 | $52,840 |
| 2019 | $1,790 | $56,080 | $11,200 | $44,880 |
| 2018 | $1,668 | $57,120 | $11,200 | $45,920 |
| 2017 | $1,656 | $48,840 | $9,040 | $39,800 |
| 2016 | $1,698 | $49,280 | $9,040 | $40,240 |
| 2015 | -- | $52,160 | $9,040 | $43,120 |
| 2014 | -- | $53,560 | $9,040 | $44,520 |
| 2013 | -- | $53,560 | $9,040 | $44,520 |
Source: Public Records
Map
Nearby Homes
- 6818 Troupeville Rd
- 295 Sunflower
- 471 Jamar Trail
- 61 Trail of Hawk Rd
- 288 Jamar Trail
- 270 Jamar Trail
- 248 Jamar Trail
- 8262 Troupeville Rd
- 4386 Studstill Rd
- 16000 Valdosta Hwy
- 17 Green Lake Cir
- 51 Green Lake Cir
- 51 Quail Dr
- 91 Pine Forest Dr
- 67 Shady Brook Cir
- 829 Parkview Cir
- 212 Hilltop Cir
- 786 Parkview Cir
- 3924 Timber Ridge Rd
- 760 Parkview Cir
- 6950 Troupeville Rd
- 79 Orchard Way
- 36 Orchard Way
- 115 Orchard Way
- 6850 Troupeville Rd
- 80 Orchard Way
- 6980 Troupeville Rd
- 118 Orchard Way
- 135 Orchard Way
- 132 Orchard Way
- 7064 Troupeville Rd
- 167 Orchard Way
- 168 Orchard Way
- 6777 Troupeville Rd
- 76 Kelly Dr
- 50 Kelly Dr
- 118 Kelly Dr
- 55 Kelly Dr
- 95 Kelly Dr
- 7199 Troupeville Rd